Feasibility of using red cell distribution width for prediction of postoperative mortality in severe burn patients: an association with acute kidney injury after surgery
Article information

Abstract
Background
Severe burns cause pathophysiological processes that result in mortality. A laboratory biomarker, red cell distribution width (RDW), is known as a predictor of mortality in critically-ill patients. We examined the association between RDW and postoperative mortality in severe burn patients.
Methods
We retrospectively analyzed medical data of 731 severely burned patients who underwent surgery under general anesthesia. We evaluated whether preoperative RDW value can predict 3-month mortality after burn surgery using receiver operating characteristic (ROC) curve analysis, logistic regression, and Cox proportional-hazards regression analysis. Mortality was also analyzed according to preoperative RDW values and incidence of postoperative acute kidney injury (AKI).
Results
The 3-month mortality rate after burn surgery was 27.1% (198/731). The area under the ROC curve of preoperative RDW to predict mortality after burn surgery was 0.701 (95% confidence interval [CI], 0.667–0.734; P < 0.001) with a cut-off point of 12.9. The adjusted hazard ratio in patients with RDW > 12.9 was 1.238 (95% CI, 1.138–1.347; P < 0.001). Subgroup analysis showed that the survival rate was 88.8% for the non-AKI group with RDW ≤ 12.9 and 17.6% for the AKI group with RDW > 12.9. Preoperative RDW was considered an independent risk factor for mortality (odds ratio, 1.679; 95% CI, 1.378–2.046; P < 0.001).
Conclusions
Preoperative RDW may predict 3-month postoperative mortality in patients with severe burns, while preoperative RDW > 12.9 and postoperative AKI may further increase mortality after burn surgery.
INTRODUCTION
Severe burn can induce injuries of almost every organ and lead to serious complications including mortality. Extensive inflammation by severe burn can be detrimental [1]. However, mortality rate has decreased with advances in management of burn patients and with the accumulated knowledge of prognostic factors for mortality [2].
Because systemic inflammation eventually results in leukopenia, thrombocytopenia, and coagulopathy after burn injury, useful biomarkers have been reported to predict mortality in burn patients [3]. Red cell distribution width (RDW), acquired easily through a simple complete blood count (CBC), has been recognized for its predictive capability concerning fatal outcomes in diverse diagnostic circumstances [4]. High RDW value in burn patients is known to be relevant to mortality, but it is not considered as an independent risk factor [5]. Additionally, RDW can act as an independent predictor of acute respiratory distress syndrome following major burn injury [6]. However, the relationship of preoperative RDW with postoperative mortality in the critically-ill patients who undergo burn surgery under general anesthesia is not clearly understood.
Massive fluid loss and inflammation in burn patients cause acute kidney injury (AKI) which is one of the serious complications affecting mortality. Since the progression of AKI leads to mortality, it is essential to understand the association of this complication with perioperative variables.
Our previous report using machine learning models showed that RDW is the most important postoperative predictor of mortality among the laboratory factors [7]. However, the authors believe that it is necessary to verify previous results using the classic statistical method.
Therefore, the purpose of this study was to investigate the predictive value of preoperative RDW as a risk factor in 3-month mortality in critically-ill patients who underwent burn surgery. In addition, we investigated the effect of postoperative incidence of AKI and preoperative RDW on mortality prediction.
MATERIALS AND METHODS
1. Study population
This retrospective study received approval from the Institutional Review Board of the ethical committee, and the informed consent was waived. This study was conducted in accordance with the Ethical Principles for Medical Research Involving Human Subjects as outlined in the Helsinki Declaration of 1975 (revised 2013). Burn patients scheduled for surgery under general anesthesia from January 2010 to February 2018 were eligible. Patients hospitalized in the intensive care unit (ICU) with second- or third-degree burns whose burn event was within 14 days were included in this study. Exclusion criteria were as follows: (a) age < 18 years, (b) local anesthesia, (c) total body surface area (TBSA) burned < 20%, and (d) chronic kidney disease. We retrospectively collected the laboratory and clinical information from the electronic health record system of these patients.
2. General anesthesia and burn surgery
All patients fasted for 8 h prior to elective surgery and did not receive premedication. Upon arrival in the induction room, blood pressure, oxygen saturation, and electrocardiograph were applied. Propofol and rocuronium was used to induce the patients for general anesthesia. The patients were maintained with nitrous oxide combined with sevoflurane (2.0–3.0 vol%) or desflurane (6.0–8.0 vol%) at a fractional inspired oxygen concentration of 0.5–1.0 depending on the partial pressure of oxygen of the patient. Patients were ventilated to target an end-tidal CO2 of 30-35 mmHg. Intraoperative hemodynamic management was controlled based on the vital signs and further perioperative clinical circumstances were handled in adherence to our institution protocol.
The types of surgery for burn patients included escharotomy, fasciotomy, debridement, cadaveric skin graft, and split-thickness skin graft depending on the degree of burn. The standard care of surgical treatment of burn patient was early excision and prompt grafting either with cadaveric skin graft or autograft. Majority of the surgical patients went through skin grafting after excision of necrotic deep second- and third-degree burn wounds.
3. Data collection
All data collection was performed retrospectively. The results of the blood test of the first surgery for each patient were included in the analysis. The preoperative laboratory data of the blood test was taken the day before or on the day of surgery. Patients’ demographics and characteristics comprised age, sex, body mass index (BMI), presence of diabetes mellitus (DM) or hypertension, TBSA burned, American Society of Anesthesiologists physical status, and inhalation injury status. The extent of the burn injury was expressed as the patient’s TBSA (%) burned. Superficial burns were excluded from the assessment of TBSA burned. Bronchoscopy was used for the diagnosis of inhalation injury. Bronchoscopic findings in inhalation injury may present with congestion, edema, mucosal ulceration and necrosis [8]. The collected preoperative variables included platelet count, hemoglobin (Hb), prothrombin time (PT), creatinine (Cr), albumin, RDW, neutrophil-lymphocyte ratio (NLR), monocyte-lymphocyte ratio (MLR), platelet-lymphocyte ratio (PLR), and systemic immune-inflammation index (SII) [9-11]. SII was determined from the equation, platelet × neutrophil / lymphocyte [12]. Duration of anesthesia along with hospital and ICU stay were recorded. Postoperative AKI was determined by an elevation of serum Cr by at least 0.3 mg/dl within 2 days (48 h) of surgery or an elevation in serum Cr to ≥ 1.5 times the baseline value within 7 postoperative days according to the Kidney Disease: Improving Global Outcomes (KDIGO) criteria [13]. Due to the irregularities in the urine output measurement, urine output criterion of KDIGO was not included in this study.
4. Preoperative RDW to predict 3-month mortality
The capability of preoperative RDW to predict 3-month mortality after burn surgery under general anesthesia was determined. The cut-off point of RDW was analyzed which was the criteria to divide the groups into two for comparison of the clinical findings. The comparison between the survival probability of the two groups was evaluated.
5. Association of postoperative AKI with preoperative RDW on mortality prediction
The incidence of postoperative AKI in survivor and non-survivor group was evaluated with a subgroup analysis associated with the cut-off point of RDW. The patients were divided into four subgroups according to the cut-off point of preoperative RDW for mortality and the presence of postoperative AKI. Postoperative factors such as ICU stay, incidence of postoperative AKI, and 3-month mortality were compared in the groups divided by the RDW cut-off point.
6. Preoperative risk factors associated with mortality
The preoperative demographics and laboratory findings were compared between the survivor and non-survivor groups to determine the risk factors of mortality in patients who underwent surgery under general anesthesia. In addition, hospital and ICU stay was evaluated in these groups.
7. Statistical analysis
The receiver operating characteristic (ROC) curve analysis was used to determine the predictive validity of preoperatively measured RDW for mortality after burn surgery. The optimal cut-off point of RDW for predicting mortality was evaluated using the ROC curve analysis. The Student’s t-test or Mann-Whitney U test was used appropriately to compare continuous variables of the baseline characteristics and laboratory findings between the two groups. Normality test to confirm the normal distribution of the data was performed ahead of t-test using Shapiro-Wilk test. All continuous variables are shown as mean ± standard deviation. Categorical variables which are depicted as number (percentage) were analyzed using the Chi-square test or Fisher’s exact test. The hazard ratio of 3-month mortality by the cut-off point of preoperative RDW was evaluated by Cox proportional hazards regression with adjustment. In addition, the survival rate was conducted by Kaplan-Meier survival analysis with log-rank test.
Univariate and multivariate logistic regressions were utilized to analyze the risk factors for 3-month mortality after surgery in severe burn patients. Significant predictors identified on univariate regression were obtained to build a multivariate logistic regression using a backward stepwise elimination procedure. Statistical analyses were performed with MedCalc (version 11.3.3.0, MedCalc Software) and the Statistical Package of Social Sciences (version 24.0, SPSS Inc.). P value < 0.05 was regarded as statistically significant.
RESULTS
1. Study population
Among a total of 1,488 burn patients admitted to the ICU before surgery under general anesthesia, 731 patients met the inclusion criteria (Fig. 1). The overall postoperative 3-month patient mortality rate reached 27.1% (198/731).
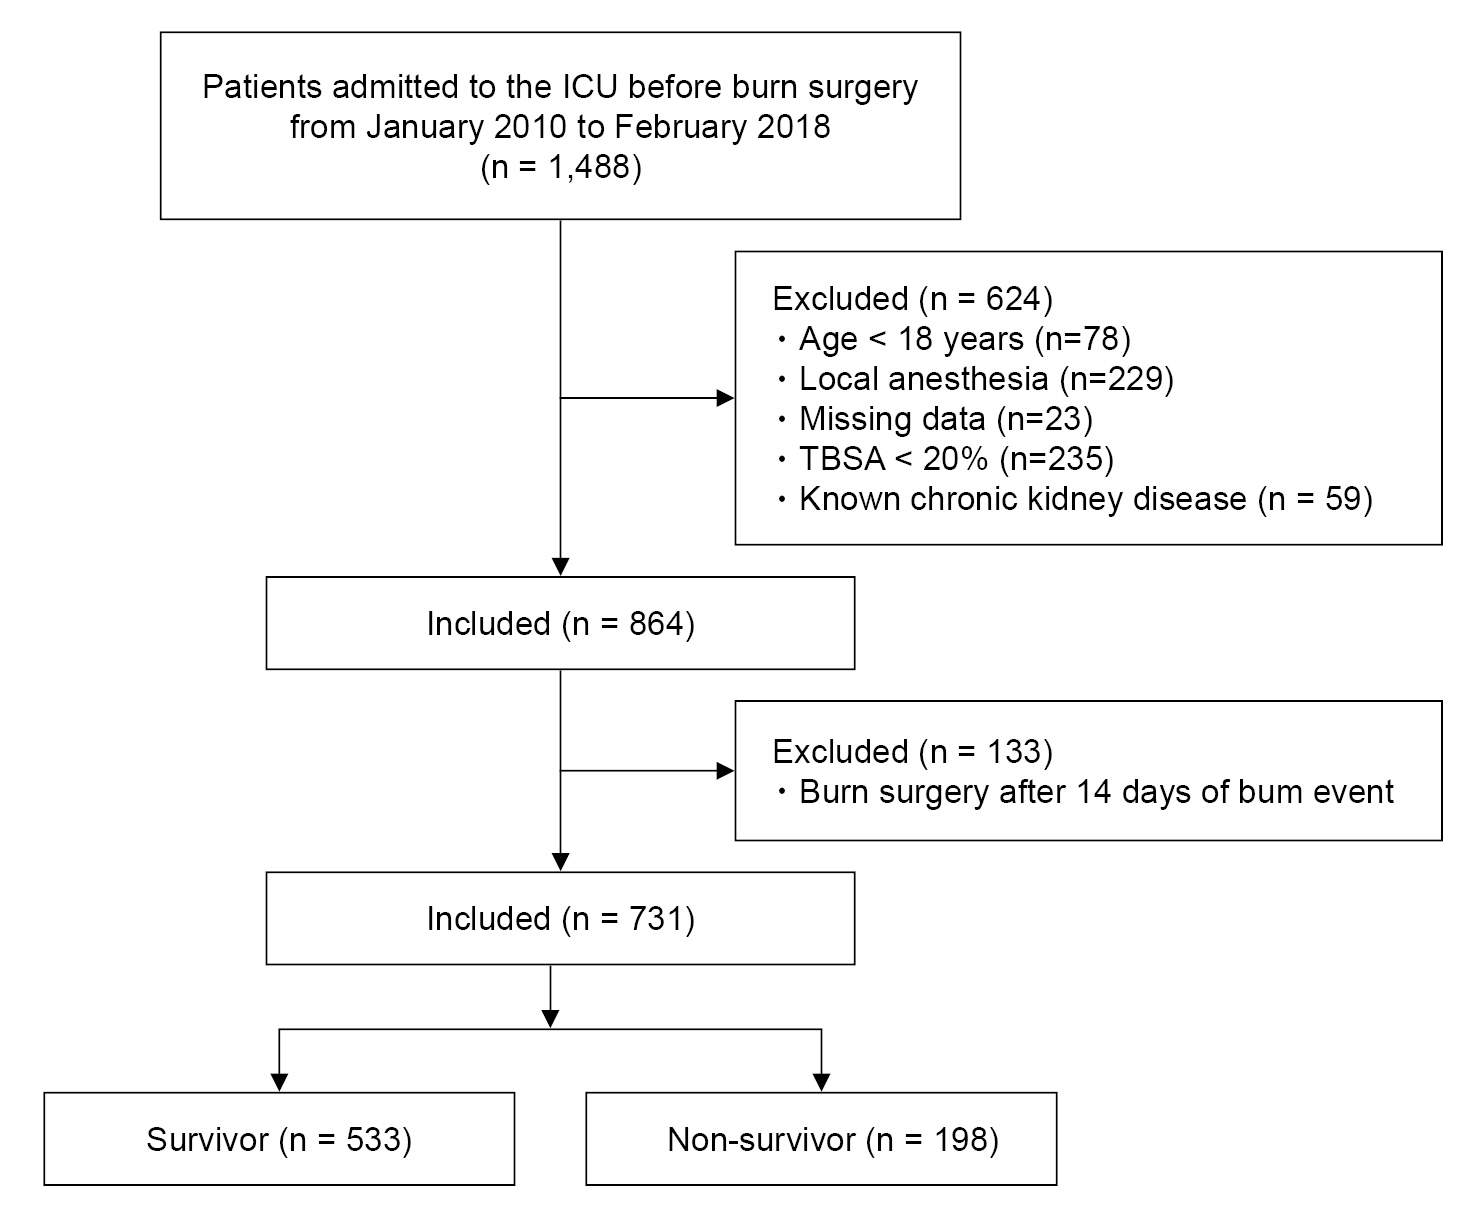
Flow diagram outlining the participant selection process for survivor and non-survivor groups. ICU: intensive care unit, TBSA: total body surface area.
2. Preoperative RDW to predict 3-month mortality
Fig. 2 shows the ROC curve analysis of the preoperative RDW for prediction of postoperative mortality under general anesthesia in severe burn patients. The AUC was 0.701 (95% confidence interval [CI], 0.667–0.734; P < 0.001) with an optimal cut-off point of 12.9 (sensitivity and specificity, 73.7% and 58.0%, respectively). The sensitivity and specificity for each cut-off point are displayed in Supplementary Table 1. Patients were divided into two groups according to the cut-off point of preoperative RDW. Table 1 demonstrates the comparison of baseline characteristics and laboratory findings between the RDW ≤ 12.9 (n = 361) and RDW > 12.9 groups (n = 370). Among the collected variables, age, sex, DM, TBSA burned, inhalation injury, Hb, RDW, albumin, PT, Cr, NLR, PLR, and SII showed significant differences between the groups. Cox proportional hazards regression adjusted by age, DM, hypertension, American Society of Anesthesiologists physical status, inhalation injury, TBSA burned, platelet, albumin, PT, and Cr showed that the hazard ratio of 3-month mortality was 1.238 (95% CI, 1.138–1.347; P < 0.001) in the RDW > 12.9 group (Table 2). The survival probability of the group with RDW ≤ 12.9 was 85.6%, while the RDW > 12.9 group had a 61.1% likelihood of survival (log-rank test, P < 0.001, Fig. 3A).
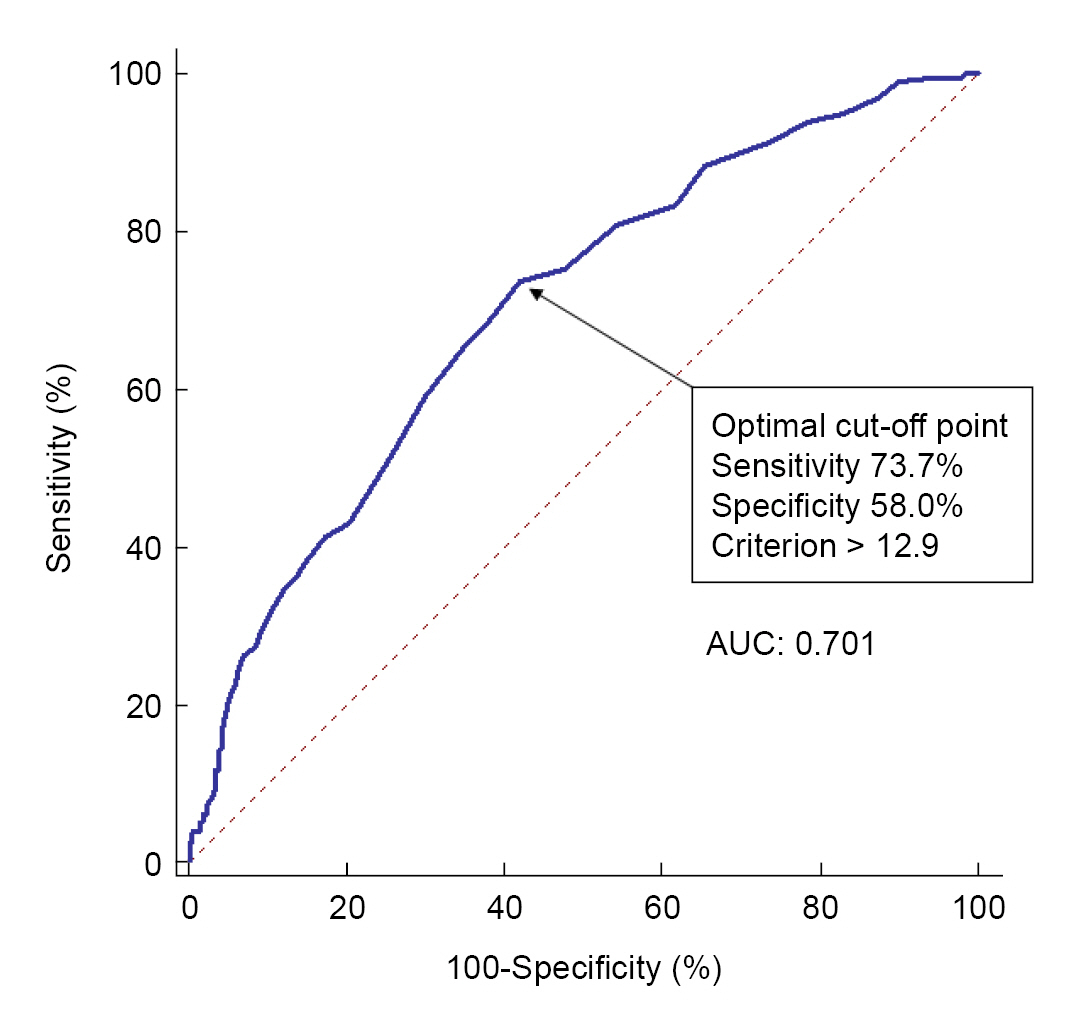
Receiver operating characteristics (ROC) curve analysis of preoperative red cell distribution width (RDW) for prediction of 3-month mortality after burn surgery. The ROC curve was used to determine the cut-off point of preoperative RDW which was 12.9. The area under the ROC curve (AUC) was 0.701.

Patient Demographics of the Preoperative RDW ≤ 12.9 and RDW > 12.9 Groups

Hazard Ratios of 3-month Mortality after Burn Surgery in Patients with Preoperative RDW ≤ 12.9 and RDW > 12.9
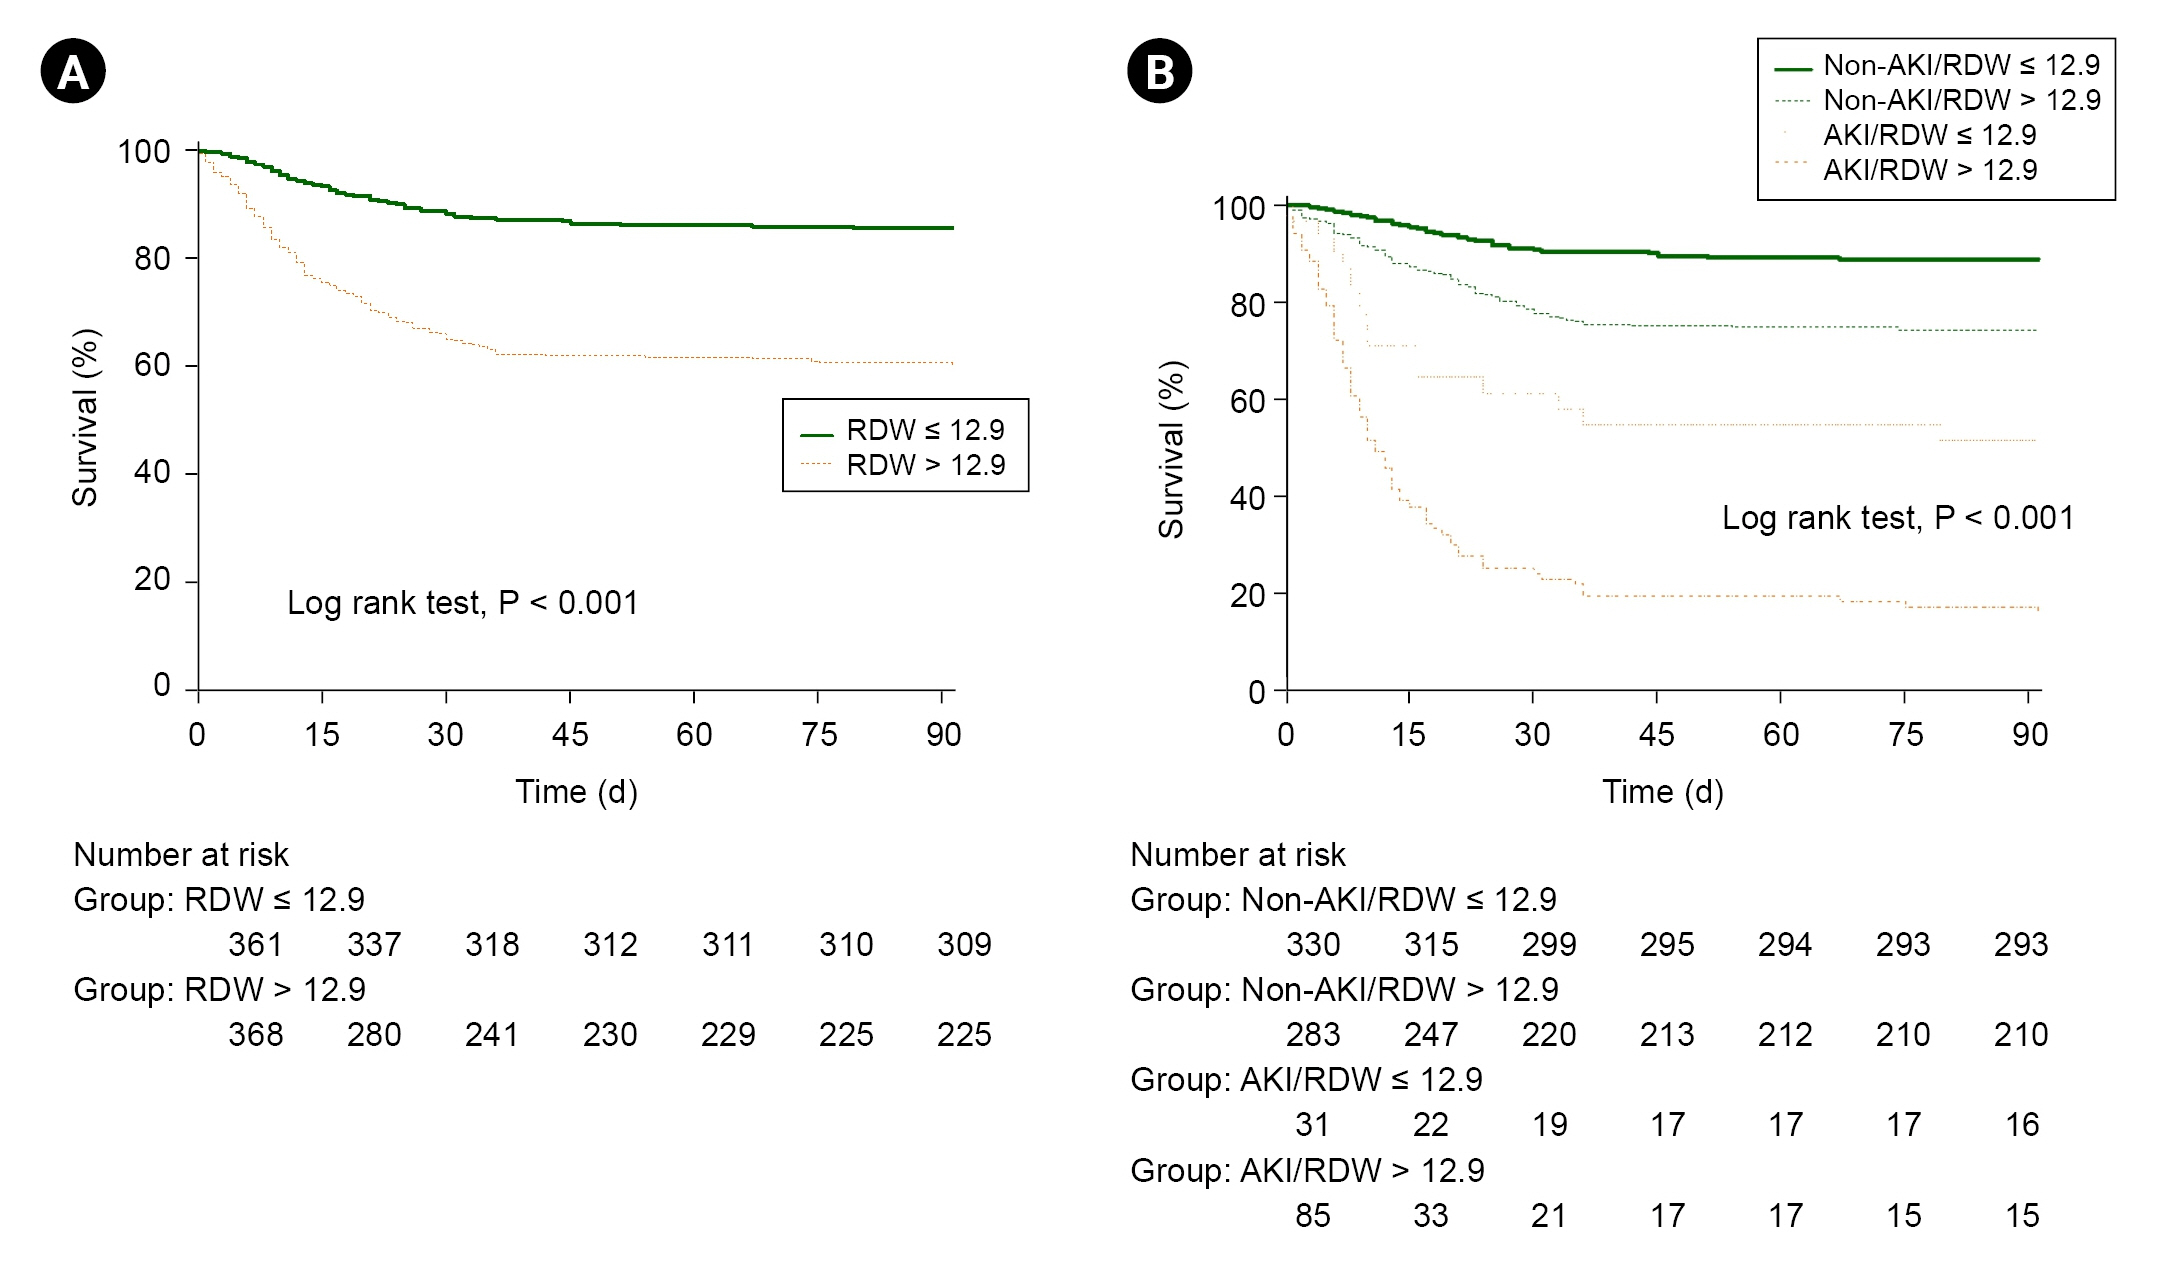
Kaplan-Meier curve of 3-month survival of the patients after burn surgery. (A) Survival probability according to preoperative cut-off value of RDW. The green line (solid) indicates the group with preoperative RDW ≤ 12.9 and the orange line (dotted) indicates the group with preoperative RDW > 12.9. (B) Subgroup analysis of survival probability according to postoperative AKI. The green solid line indicates the group with no postoperative AKI and preoperative RDW ≤ 12.9, which had the best survival probability among the other groups. AKI: acute kidney injury, RDW: red cell distribution width.
3. Association of postoperative AKI with preoperative RDW on mortality prediction
The incidence of AKI after surgery was higher in the non-survivor group than in the survivor group in severe burn patients (n=88, 44.4% vs. n=30, 5.6%, P < 0.001). Subgroup analysis according to postoperative AKI showed that the survival rate was 88.8%, 74.2%, 51.6%, and 17.6% in the non-AKI with RDW ≤ 12.9 group, non-AKI with RDW > 12.9 group, AKI with RDW ≤ 12.9 group, and AKI with RDW > 12.9 group (log-rank test, P < 0.001), respectively (Fig. 3B). ICU stay, postoperative incidence of AKI, and 3-month mortality also differed significantly in the two RDW groups (Table 3).

Intraoperative and Postoperative Characteristics of the Preoperative RDW ≤ 12.9 and RDW > 12.9 Groups
4. Preoperative risk factors associated with mortality
Factors including sex, BMI, Hb, NLR, MLR, PLR, and SII between survivors and non-survivors did not depict significant difference after burn surgery (Supplementary Table 2). Additionally, more patients with DM, hypertension, and inhalation injury in the non-survivor group were observed than in the survivor group. Platelet count, PT, RDW, albumin, and Cr significantly differed between survivors and non-survivors after burn surgery. Using the selected predictors by the univariate analysis, age, American Society of Anesthesiologists physical status III & IV, DM, TBSA burned, RDW, PT, and Cr were obtained by multivariate regression as independent risk factors for mortality in surgical burn patients (Supplementary Table 3). In this analysis, RDW was considered as an independent risk factor for mortality (odds ratio, 1.679; 95% CI, 1.378–2.046; P < 0.001). Duration of anesthesia showed no significant effects between the two groups (P = 0.844). Hospital stay was 71.4 ± 37.5 days for the survivor group and 21.2 ± 19.9 days for the non-survivor group (P < 0.001), while ICU stay was 29.1 ± 23.8 days for the survivor group and 21.4 ± 19.6 days for the non-survivor group (P < 0.001) (Supplementary Table 4).
DISCUSSION
The present study showed that preoperative RDW may be a significant predictor of 3-month mortality after severe burn patients who underwent surgery under general anesthesia. Mortality after burn surgery was 1.238 times higher in the high RDW group than in the low RDW group. This result is consistent with a previous study in which machine learning models were used to suggest that RDW may be a significant predictor of postoperative mortality in severe burn patients [9].
Burn injury involves intricate pathophysiological mechanisms that complicate the management of the patient [14]. One of these mechanisms is microvascular dysfunction, which leads to an immunosuppressed state that is susceptible to multiple organ failure and mortality [15]. Moreover, many different types of blood cells are involved in such burn-induced systemic inflammatory reactions. Inflammatory biomarkers, such as SII, NLR, MLR, and PLR, can be easily measured from standard composites of blood cell components at a low cost. They are routinely used in clinical practice and can be easily calculated. Moreover, the prognostic value of NLR, MLR, and PLR has been studied in burn patients [16]. Since NLR is considered a marker for inflammation, it has been proposed as a novel marker for mortality in critically ill patients [17]. Additionally, non-survivors had significantly higher NLR compared to survivors in burn patients admitted to the ICU [16]. However, not all of our study results were in accordance with previous reports since we evaluated the mortality after burn surgery that was performed under general anesthesia. SII is known to have better prognostic results than NLR or PLR in colorectal cancer patients after surgery [18]. Although these CBC biomarkers are considered to be more specific than C-reactive protein or erythrocyte sedimentation rate [19], the present results revealed that they may not be correlated with mortality after burn surgery performed under general anesthesia. Furthermore, one of the reasons why our results showed that RDW demonstrates a higher correlation with the mortality in burn patients compared to the biomarkers such as NLR, MLR, PLR, or SII is that these biomarkers are markers of inflammation and immune system activity. But RDW is more related to red blood cell characteristics and it indicates a wider range of health issues such as chronic diseases, nutritional deficiencies as well as immune system.
Alternatively, RDW is used to evaluate the size variability of circulating RBCs. In certain conditions, RBC count increases or decreases due to increased RBC destruction, ineffective RBC production, or blood transfusion. Consequently, changes in erythrocyte homeostasis eventually result in extensive RBC size heterogeneity, depicted as elevated RDW, which indicates pathologic conditions [20]. The pathophysiology of the relationship between RDW and mortality is unclear, although inflammatory cytokines, microvascular alterations, and oxidative stress may be related [21]. Studies on the relationship of RDW with mortality in critically ill patients has been published in various clinical conditions, such as heart failure [22] and sepsis [23]. In burn injury, RDW was significantly elevated in non-survivors during the first week of burn injury [16]. Similarly, we found that preoperative RDW was a strong independent predictor of mortality after burn surgery performed under general anesthesia in severe burn patients. In special medical conditions such as burns, our study suggests that even if the RDW value is within the normal range, it may have clinical significance. A retrospective study by Qiu et al. [24] reported that the cut-off points of RDW were 13.5 for the 3rd day and 13.6 for the 7th day postburn. In another study with 205 patients, Tang et al. [25] demonstrated that RDW showed a cut-off point of 14.55. Also, a very recent study showed a value of 13.05 for 30-day postburn mortality [26]. These studies included severe burn patients with TBSA of more than 30%. The slight difference of the inclusion criteria of these studies may have influenced the results in the variation of the cut-off points of RDW. Thus, further studies such as meta-analysis for optimal RDW cut-off point in severe burn patients may be necessary.
AKI is a devastating complication that eventually leads to increased mortality in burn patients [27]. Severe burn patients are subjected to aggressive fluid resuscitation which is preceded by extreme volume depletion, and such measures may cause abdominal compartment syndrome and intra-abdominal hypertension [28]. Studies have demonstrated associations between AKI and RDW and their impact on mortality [29]. In our study, we found that AKI group with high RDW (> 12.9) have the lowest survival rate, which is one-fifth the rate of non-AKI group with low RDW (≤ 12.9) for 3-month postoperative mortality. This outlines the necessity to prevent the occurrence of postoperative AKI in burn patients with high preoperative RDW. Moreover, non-AKI group with high RDW showed higher survival rate compared to AKI group with low RDW. This suggests that despite the low RDW, presence of AKI had more crucial effect on the survival rate. Although the underlying mechanism between RDW and AKI is not fully understood, several hypotheses have been reported. For example, inflammatory reactions and oxidative stress of AKI are reflected by RDW values. Furthermore, in AKI, the renin-angiotensin system promotes the release of erythropoietin and leads to excessive erythropoiesis with increased RBC heterogeneity [30].
Older age, larger TBSA, presence of DM, prolonged PT, elevated Cr are known risk factors for multiple organ failure and mortality after burns, which is corroborated by our results [31]. Notably, TBSA burned is an important risk factor of mortality in burn injury [32]. In addition, the vulnerability to infection and poor physiological conditions may influence the adverse outcomes of older patients after burn injury [33].
Our study has several limitations. First, the retrospective design resulted in inevitable missing or inaccurate data. Second, although this was a single-center analysis, perioperative clinical management in this 8-year study might have changed over time. Third, all intraoperative data including volume management and blood loss were not evaluated in this study. However, since the patient cohort were analyzed in a single center with a protocolized process of burn patient management, this limitation would have minimal influence on the outcomes of our study. Fourth, since only preoperative RDW value was analyzed for 3-month mortality after burn surgery, the predictive validity of RDW towards mortality cannot be applied to different time points throughout hospital stay. Lastly, this study did not investigate whether the high mortality predicted by high preoperative RDW is related to complications other than postoperative AKI. Therefore, it cannot be excluded that mortality related to other postoperative complications after surgery other than high preoperative RDW before surgery may be higher. These limitations should be considered when planning further studies.
In conclusion, this study showed that preoperative RDW may have the ability to predict 3-month mortality after burn surgery performed under general anesthesia in critically-ill burn patients. The high RDW group had a 1.238-fold higher 3-month mortality rate after burn surgery compared to the low RDW group. Furthermore, in severe burn patients with high RDW prior to burn surgery, development of postoperative AKI may further increase the rate of mortality. Therefore, physicians should strive for proper management to prevent postoperative AKI, especially in severe burn patients with high preoperative RDW.
SUPPLEMENTARY MATERIALS
Supplementary data is available at https://doi.org/10.17085/apm.23046.
Sensitivity and specificity of each cut-off value of red cell distribution width. 12.9 (*) is the optimal cut-off value for prediction of mortality in burn surgery patients
Baseline characteristics and laboratory findings of the survivor and non-survivor group
Univariate and multivariate analyses for evaluating the risk factors of 3-month mortality after burn surgery
Intraoperative and postoperative characteristics of the survivor and non-survivor groups
Notes
FUNDING
None.
CONFLICTS OF INTEREST
No potential conflict of interest relevant to this article was reported.
DATA AVAILABILITY STATEMENT
The datasets generated during and/or analyzed during the current study are available from the corresponding author on reasonable request.
AUTHOR CONTRIBUTIONS
Writing - original draft: Ji Hyun Park. Writing - review & editing: Seong-Soo Choi. Conceptualization: Seong-Soo Choi, Ji Hyun Park, Seong-Sik Cho. Data curation: Ji Hyun Park, Jongeun Jung. Formal analysis: Ji Hyun Park, Jongeun Jung. Methodology: Seong-Soo Choi. Project administration: Seong-Sik Cho. Visualization: Ji Hyun Park, Jongeun Jung. Investigation:Ji Hyun Park, Seong-Sik Cho. Resources: Seong-Sik Cho, Jongeun Jung.
Software: Seong-Sik Cho, Jongeun Jung. Supervision: Seong-Soo Choi. Validation: Seong-Soo Choi, Seong-Sik Cho.