Comparison of oxycodone and fentanyl for postoperative patient-controlled analgesia after orthopedic surgery
Article information

Abstract
Background:
Oxycodone is widely used as bolus or patient-controlled analgesia (PCA) for control of postoperative pain. The aim of this study was to assess the efficacy and side effects of oxycodone for somatic pain by comparing oxycodone and fentanyl intravenous PCA after orthopedic surgery.
Methods:
Seventy-three patients undergoing orthopedic surgery were randomly assigned to receive fentanyl or oxycodone using intravenous PCA (potency ratio 1:60). Pain severity at rest and with movement and adverse effects were assessed at 1, 6, 24, and 48 hours after surgery. The PCA dose and patient satisfaction scores were measured at 48 hours after surgery.
Results:
The resting visual analogue scale (VAS) and moving VAS scores of the oxycodone group were significantly higher than those of the fentanyl group at 6 hours (P = 0.001, P = 0.021), but at 48 hours, the resting and moving VAS of the oxycodone group were significantly lower than those of the fentanyl group (P = 0.014, P = 0.037). There were no significant differences in adverse effects, satisfaction scores, dose of patient-controlled mode, or total cumulative PCA dose.
Conclusions:
With a 1:60 ratio of oxycodone to fentanyl when using PCA for pain control after orthopedic surgery, the use of larger doses of oxycodone for 6 hours is effective in controlling early postoperative pain.
INTRODUCTION
Adequate control of pain in orthopedic surgery is required for patients to fully participate in physical rehabilitation, which requires mechanical loading of the operated bone or joint [1,2]. Inadequate pain control can interfere with effective rehabilitation and develop into chronic persistent postoperative pain owing to sensitization of the nerve system [3,4].
A common method to control postoperative pain is the use of opioids. Among the opioids, oxycodone, morphine, and fentanyl are widely used as bolus or patient controlled analgesia (PCA) for postoperative pain control.
Equivalent doses of fentanyl and morphine and oxycodone and morphine are known to be 1:80–100 [5] and 1:1, respectively [6], but the equivalent dose of oxycodone and fentanyl is controversial. In a number of studies of postoperative analgesia performed following abdominal surgery, the potency of oxycodone and fentanyl has been observed to be less than 1:100. Several studies revealed that oxycodone was more effective in visceral pain [7–9]. The aim of this prospective randomized study was to assess the efficacy and side effects of oxycodone on somatic pain by comparing oxycodone and fentanyl intravenous (IV)-PCA after orthopedic surgery.
MATERIALS AND METHODS
Prior to performance of the study, the study protocol was approved by an appropriate Institutional Review Board of the Daegu Fatima Hospital (IRB no. DFA14MRIO293). Written informed consent was obtained from 73 patients scheduled to undergo orthopedic surgery including open reduction of lower limb, total knee replacement, total hip replacement, arthroscopic knee ligament surgery, and arthroscopic shoulder ligament surgery under general anesthesia. Patients enrolled in the study were of American Society of Anesthesiologists physical status classification I, II, or III and aged between 20 and 80 years. All patients were randomly assigned to one of two groups receiving either oxycodone (group O) or fentanyl (group F) for postoperative IV-PCA, according to a computer-generated randomized table by Excel (Microsoft Corp., Korea). A blind observer assessed participants’ pain severity at rest and with movement, side effects, and PCA dosage. Exclusion criteria consisted of history of severe hepatic, renal, pulmonary, or cardiac disease; bleeding disorder; underlying psychological disorders; chronic pain with history of opioid usage; communication disability; lack of ability to use PCA; side effects with previous opioid usage; and pregnancy.
All patients were administered 0.2 mg of glycopyrrolate, 2 mg of midazolam intramuscularly, and 20 mg of famotidine intravenously as premedications. Upon arrival in the operating room, all patients underwent continuous monitoring of vital signs using electrocardiography, blood pressure cuff, pulse oximetry, and capnography.
General anesthesia was induced with 2 mg/kg of propofol, 0.6 mg/kg of rocuronium, and a remifentanil infusion of 20 μg/min. Sevoflurane was used for maintenance of anesthesia, and a remifentanil infusion of 5–20 μg/min was used for analgesia. A dose of 0.3 mg of ramosetron was administered intravenously, and another 0.3 mg of ramosetron was mixed into the IV-PCA for prevention of postoperative nausea and vomiting (PONV). After the operation, sevoflurane and remifentanil were discontinued, and 0.2 mg of glycopyrrolate and 10 mg of pyridostigmine were administered for reversal of neuromuscular blockade. Tracheal extubation was performed after recovery of response to verbal commands and spontaneous respiration. Patients were then transferred to the postanesthetic care unit (PACU), where they continued to undergo monitoring with electrocardiography, blood pressure, pulse oximetry, and capnography. All patients were observed in the PACU for 1 hour before being transferred to the general ward. A PCA pump (AutoMed 3400®, Ace Medical, Korea) was connected to all patients for postoperative pain control.
Oxycodone 120 mg in group O and fentanyl 2,000 μg in group F, with 180 mg of ketorolac, 0.3 mg ramosetron, and normal saline were mixed to a volume of 100 ml. The PCA regimen for both groups included basal infusion of 1.2 ml/h, bolus dose of 1.2 ml, and lockout interval of 15 minutes. We administered fentanyl and oxycodone in a potency ratio of 1:60.
If a patient reported severe pain with a visual analogue scale (VAS) score above 70, either oxycodone 3 mg or fentanyl 50 μg was administered as an IV bolus as rescue analgesia, depending on the patient’s assigned group. When moderate to severe nausea or vomiting developed in the PACU, 10 mg of metoclopramide was administered.
Evaluations for pain severity and adverse effects were performed at 1, 6, 24, and 48 hours postoperatively. Pain scores were evaluated using the VAS with scores ranging from 0 (no pain) to 100 (worst pain imaginable) in two categories, at rest and with movement. Pain at rest was defined as pain on lying supine, and pain with movement was defined as pain observed with activities including rehabilitation exercises, lifting limbs, sitting, walking, and rolling. The occurrence of adverse effects such as nausea, vomiting, dizziness, headache, and sedation was observed and recorded at each time point. Overall patient satisfaction with the PCA was evaluated on a 5-point scale (1 = very unsatisfied, 2 = unsatisfied, 3 = neutral, 4 = satisfied, or 5 = very satisfied). The total PCA dose and cumulative dose in patient-controlled mode (PCM) were checked at 48 hours after surgery.
Based on pilot studies, we estimated the sample size to detect differences in VAS scores with mean differences between the groups, with a power of 80% and = 0.05. The power analysis indicated that a sample size of 28 per group was required to detect significant differences in VAS scores of more than 10 between group O and group F with a standard deviation of 13 for each group in the preliminary test. Fifty-six patients were required to allow for possible incomplete data collection or patient dropout. Power and Sample Calculators (HyLown Consulting LLC, USA; available from the web site: http://powerandsamplesize.com/Calculators/) were used for sample size calculation. For statistical analysis of the collected data, IBM SPSS 21.0 (IBM Co., USA) was used. To compare the groups, Student’s t-tests were performed for variables with normal distributions, such as patient information regarding age, weight, height, and opioid consumption. The Mann-Whitney U test was used to analyze patient satisfaction with analgesia. Repeated measures analysis of variance and Student’s t-test were used to analyze VAS scores. Categorical variables such as sex, American Society of Anesthesiologists physical status classification, type of operation, and adverse effects were analyzed using the chi-square test and Fisher’s exact test, as appropriate. A P value < 0.05 was considered to indicate statistical significance.
RESULTS
Sixty-one patients were included in the study analysis. Seventy-three patients were included in the study after randomization, but 4 patients in the fentanyl group and 8 patients in the oxycodone group requested early discontinuation of the PCA owing to emesis.
There was no significant difference between the two groups in the distribution of height, weight, age, sex, American Society of Anesthesiologists physical status classification, or type of surgery (Table 1).

Summary of Baseline Characteristics
Development of side effects including nausea, vomiting, dizziness, headache, and sedation with respiratory depression was examined four times in the initial 48 hours after surgery (1, 6, 24, 48 hours). Side effects at each time segment and the overall number of patients who experienced each side effects in the oxycodone group were not significantly different from those in the fentanyl group (Table 2).

Incidence of Postoperative Adverse Effects during 48 Hours
Regarding VAS scores, both resting VAS scores (Fig. 1) and moving VAS scores (Fig. 2) decreased with time (P values all < 0.001). The changes of VAS with time differed between the two groups (resting VAS, P = 0.004 and moving VAS, P = 0.000). Resting VAS at 6 hours and moving VAS at 6 hours were significantly higher in group O, but resting VAS at 48 hours and moving VAS at 48 hours were significantly lower in group O (Table 3).
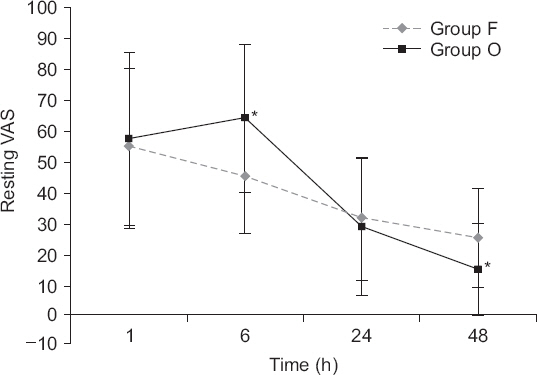
Graphs indicate mean and standard deviation. Repeated measures analysis of variance was performed. There was a significant effect of time (P values were < 0.001). There was a significant effect of time (P values were < 0.001) and the changes in visual analogue scale (VAS) with time differed between the two groups (P = 0.004). *P < 0.05 according to Student’s t-test.
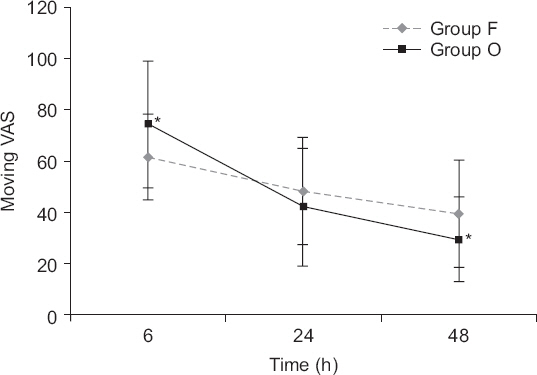
Graphs indicate mean and standard deviation. Repeated measures analysis of variance was performed. There was a significant effect of time (P values were < 0.001) and the changes in visual analogue scale (VAS) with time differed between the two groups (P < 0.001). *P < 0.05 according to Student’s t-test.

Comparison of Resting and Moving VAS between Groups at Each Time Segment
Total PCA dose and cumulative PCA dose in PCM were measured in both groups.
Total PCA dose (ml) - Group F: 82.9 ± 24.3, Group O: 82.9 ± 27.9, P = 0.998
Cumulative PCA in PCM (ml) - Group F: 15.5 ± 11.8, Group O: 13.6 ± 12.9, P = 0.564
There was no significant difference between the two groups.
The median and interquartile range of the satisfaction scores was 2 (2–3) in group O and 2 (2–3) in group F. There was no significant difference between the two groups (P = 0.506).
DISCUSSION
Oxycodone is a semisynthetic opioid derived from thebaine [10]. Today, oxycodone is widely used for the management of chronic pain in controlled release tablets, and is also administered through various routes such as IV, intramuscular, subcutaneous, rectal, and epidural [11–15]. Numerous studies have suggested that IV oxycodone is an effective treatment for acute postoperative pain [16,17]. Furthermore, determination of the proper dosage regimen of oxycodone is important for effective pain control. However, few studies have examined the effect of IV oxycodone compared with fentanyl when used as PCA, and it has been difficult to find data regarding comparison of oxycodone and fentanyl in the control of pain after orthopedic surgery.
IV or parenteral oxycodone appears to be equipotent with morphine [6,18]. The potency ratio of fentnayl to morpine is 1:80–100 [5]. However, there is significant debate regarding the equipotent ratio of fentanyl to oxycodone. Hwang et al. [19] reported that the potency ratio was 1:75 in laparoscopic cholecystectomy, and oxycodone showed comparable effects for pain relief compared to fentnayl in spite of a smaller cumulative PCA dose. In other recent studies, the potency ratio of fentanyl and oxycodone was found to be 1:62.5 in gastrointestinal laparotomy, 1:60 in laparoscopic benign gynecological surgery, and 1:55 in colorectal surgery, and oxycodone was shown to provide similar analgesic efficacy to that of fentanyl [20–22].
In the present study, the potency ratio of fentanyl to oxycodone as a PCA dose as well as rescue dose was 1:60. Resting VAS and moving VAS at 6 hours were higher in the oxycodone group. This finding may be the result of the fact that orthopedic surgery ranks higher in pain intensity than the previously mentioned laparoscopic cholecystectomy, laparoscopic hemicolectomy, or laparoscopic gynecological surgery [23]. Consistent with this view, some studies have suggested that the minimum effective concentration (MEC: the drug concentration at the time re-medication is required) and minimum effective analgesic concentration (MEAC: the concentration at which the drug is equilibrated between plasma and effect-site compartments containing its receptors, and analgesia is elicited) of oxycodone may differ between different types of surgery. In patients undergoing laparoscopic cholecystectomy, the MEC and MEAC of oxycodone are 20–35 ng/ml and 45–50 ng/ml, respectively [24]. The MEC and MEAC of IV oxycodone for cardiac surgery have been reported as 6–12 ng/ml and 15–25 ng/ml, respectively [25]. Therefore, orthopedic surgery seems to require increasing the dose of PCA according to the intensity of the pain, because the intensity of the initial postoperative pain of orthopedic surgery is stronger than the pain of abdominal surgery. The rescue dose in the recovery room should also be increased. Pharmacokinetic simulation demonstrated that the MEAC of oxycodone was reached most rapidly with 0.1 mg/kg, which may reduce the pain during the immediate postoperative period [26].
According to other research, oxycodone has shown significant effects in visceral pain and may provide new opportunities in the management of clinical visceral pain [27]. This is because oxycodone has antinociceptive effects that are mediated by a combination of mu-opioid and kappa-opioid receptors, although oxycodone has been considered to act as a typical mu-opioid agonist [8]. Khotib et al. [28] suggested that interactions between mu-opioid and kappa-opioid receptors appear to play a significant role in the mediation of nociception, although the mu-opioid activity of oxycodone and its metabolites is much greater than its kappa-opioid activity. Peripheral kappa-opioid receptors in the gut have been suggested to be an important feature of the visceral pain system and a possible target for attenuating peripheral nociception [29,30]. Oxycodone is an effective analgesic agent for visceral pain and somatic pain, but studies to date have shown that it is more effective for visceral pain [7–9,27]. Likewise, pain after abdominal surgery is controlled by similar or smaller amounts of oxycodone compared with the equipotent ratio of morphine or fentanyl [16–22]. Therefore, in somatic pain such as pain after orthopedic surgery, the amount of oxycodone should be higher than the dose used for visceral pain.
In both resting and moving VAS graphs, reversal occurred between 6 and 24 hours, and resting VAS and moving VAS at 48 hours were significantly lower in the oxycodone than in the fentanyl group. Consistent with these findings, Choi [26] suggested that the time to reach a 90% steady-state concentration was 5–14 hours for oxycodone at 0.1 mg/kg, compared to 11–16 hours for 2 mg, and 17.5 hours for fentanyl. The time to reach steady state was shorter for oxycodone than for fentanyl. VAS measurements at 12 hours and 18 hours would be useful in determining when to maintain the PCA dose and when to decrease it. The reason for the statistically insignificant difference in the total PCA dose and the dose in PCM was that the VAS scores were higher in group O for the first 24 hours and higher in group F for the second 24 hours.
Limitations of this study include that first, all patients did not receive the same type of surgery. The degree of pain varies according to the type of surgery and the surgical site, and limiting these to a single one could lead to more accurate study results. However, we do not expect this factor to be a source of significant differences because the surgeries included in our study are those with a high degree of pain. Second, as mentioned earlier, it would have been helpful to include additional time intervals between 6 hours and 48 hours to allow measurement of multiple parameters. In addition, we checked the total PCA dose and PCM dose at 48 hours after PCA connection. Checking the PCA and PCM doses at each time point (1, 6, 24, and 48 hours) would be more useful in determining when to increase or decrease the opioid dose. In addition, there were only 61 patients included in the present analysis, and there have been limited studies to date comparing the occurrence of adverse effects with oxycodone and fentanyl. The sex ratio was not significantly different in this study, but female sex is a strong risk factor for PONV. Therefore, studies with larger sample sizes may be necessary to reach a more definitive conclusion regarding the occurrence of adverse effects.
In the present study, we conclude that with a 1:60 ratio of oxycodone to fentanyl in the application of PCA for pain control after orthopedic surgery, the use of larger doses of oxycodone for 6 hours is effective in controlling early postoperative pain.