A comparison of oxycodone and fentanyl in the management of early postoperative pain and for patient-controlled analgesia after total abdominal hysterectomy
Article information
Abstract
Background:
Although oxycodone has been known to be superior to other opioids in postoperative care, few studies have compared its analgesic potency with that of fentanyl. We therefore examined these two drugs in terms of their dose requirements, effects on pain intensity, time needed for relief of pain, and side effects after surgery.
Methods:
We enrolled 56 healthy women scheduled for total abdominal hysterectomy and randomly allocated them to either oxycodone or fentanyl. The opioids were administered to the two groups 10 minutes before the end of the operation. In the post-anesthesia care unit (PACU) after surgery, a visual analog scale (VAS) was used to assess the patients’ pain every 10 minutes Whenever pain control was required, a bolus of the same dose of the respective drugs was repeated at 10-minute intervals. Patient-controlled analgesia (PCA) was used to manage postoperative pain. After the patient arrived on the ward, pain scores were recorded at once and then 1, 2, 3, and 24 hours thereafter.
Results:
During the hour spent in the PACU, fewer patients in the oxycodone group required the opioid, and the time needed to achieve pain relief was shorter with oxycodone than with fentanyl. Moreover, postoperative VAS levels were significantly lower in the oxycodone group both in the PACU and on the ward (over a 24–hours period). There were no significant differences in side effects between the patients given oxycodone and those given fentanyl.
Conclusions:
Oxycodone was more effective than fentanyl when administered on the basis of the recommended dose ratio (1 : 100). Although further evaluation is needed to investigate the optimal dose ratio, we would recommend a higher conversion factor (1 : 62).
INTRODUCTION
Patients who undergo laparotomy experience moderate to severe pain postoperatively. Because inadequately managed pain can have negative consequences, the proper administration of analgesics in the post-anesthesia care unit (PACU) may decrease the chances of serious postoperative complications [1]. Patient-controlled analgesia (PCA) is one of the most frequently used methods for treating postoperative pain because it reduces fluctuations in the plasma concentration of the analgesic, thus contributing to more efficient pain control.
Recently, the use of oxycodone has increased internationally, rapidly overtaking morphine as the opioid of choice [2]. Fentanyl is one of the most frequently used opioids for the management of acute postoperative pain and for PCA, but various studies using intravenous fentanyl for postoperative analgesia have revealed that pain scores remain high for 4 or 6 hours after surgery [3,4]. Therefore, we decided to use oxycodone for postoperative pain management and PCA. In other studies, oxycodone was presumed to be more effective than fentanyl based on the currently recommended conversion factor of 1 : 100 [5]; however, we found that the direct conversion of intravenous fentanyl to intravenous oxycodone did not fall within a safe range.
We aimed to compare the analgesic efficacy of fentanyl and oxycodone in patients who had visceral postoperative pain initially in the PACU and then in the ward for 24 hours. The known equivalent potency of these two opioids was assessed based on pain scores, cumulative drug consumption, sedation scales, and side effects.
MATERIALS AND METHODS
After receiving Institutional Review Board approval (NO. 2014-013), we enrolled 56 healthy female patients who had an American Society of Anesthesiologist physical status classification of I-D in this double-blind, randomized study. The women ranged in age from 37 to 68 years and received general anesthesia before undergoing elective total abdominal hysterectomy. Patients who had regularly used acetaminophen, nonsteroidal anti-inflammatory drugs, corticosteroids, anti-emetics, or opioids were excluded.
In the operating room, patients were monitored by means of pulse oximetry, electrocardiography, and noninvasive blood pressure measurements at 5-minute intervals. Thiopental, 5 mg/kg, was given intravenously, and manual ventilation was begun once unconsciousness had been confirmed. Intravenous rocuronium, 0.6 to 0.8 mg/kg, was administered prior to intubation. Once intubated, the patients were mechanically ventilated to an end-tidal PaCO2 of 35 to 40 mmHg. Sevoflurane and nitrous oxide (N2O) were used for maintenance anesthesia, and the patients were not premedicated.
Patients were randomly allocated to one of two types of analgesic: oxycodone (OxyNorm) (Mundipharma, Seoul, Korea) (n = 28) or fentanyl (fentanyl citrate) (Hana Pharm, Seoul, Korea) (n = 28). At 10 minutes before end of surgery, the patients in each group were given either 0.05 mg/kg of oxycodone or 0.5 μg/kg of fentanyl intravenously, and 0.3 mg of ramosetron was given prophylactically to prevent postoperative nausea and vomiting (PONV). There was no significant difference in the time of awakening between the two groups while still in the operating room. Arterial blood pressure was checked noninvasively at 10-minute intervals in the PACU, as was the visual analog scale (VAS). Whenever the patient needed pain control, boluses were given in consistent doses at intervals of at least 10 minutes. At the same time, patients’ responses on the Ramsay sedation scale were determined (1 = anxious, agitated, restless; 2 = cooperative, oriented, tranquil; 3 = responsive to commands only; 4 = brisk response to light glabellar tap or loud auditory stimulus; 5 = sluggish response to light glabellar tap or loud auditory stimulus; and 6 = no response to light glabellar tap or loud auditory stimulus). A VAS level of 0 corresponded to no pain and a VAS level of 10 corresponded to the worst pain one could imagine.
PCA (Ambix Anapa) (IWha-Fresenius Kabi, Seoul, Korea) using the same two opioids was instituted for pain management. The PCA regimens were as follows: (1) for fentanyl, the patient-controlled bolus dose was 0.1 μg/kg, with a lockout interval of 15 minutes and a continuous background infusion of 0.2 μg/kg/h; (2) for oxycodone, the patient-controlled bolus dose was 0.01 mg/kg, with a lockout interval of 15 minutes and a background infusion of 0.02 mg/kg/h. Pain scores were recorded at 0, 1, 2, 3, and 24 hours after the patients arrived on the ward. The cumulative consumption of opioids was checked, as were any side effects related to the opioids (PONV, itching sensation, headache, and dizziness). When moderate to severe PONV was present, patients were given metoclopramide, 10 mg. The PCA device was connected directly to the intravenous line. VAS and side effects were checked by an anesthesiologist who was not aware of which opioid the patients had received. The nursing staff on the post-delivery ward was instructed to report any problems related to the patient or use of the PCA device and routinely monitored the patients’ respiratory status.
Statistical analysis
An estimate of sample size with a standard deviation (SD) of 9 indicated that 28 patients per group would result in 80% power, at a P-value of 0.05, for detecting a mean difference in opioid consumption of at least 5% between the two groups. Repeated measures analysis of variance (ANOVA) was used for VAS scores, sedation scales, and mean arterial blood values. Data were analyzed with SAS 9.3 software, with the level of significance set at 0.05. Demographic data were presented either as means ± SD (parametric data) or as percentiles (non-parametric data). Independent samples t-tests and chi-square tests were used to analyze differences between the two groups.
RESULTS
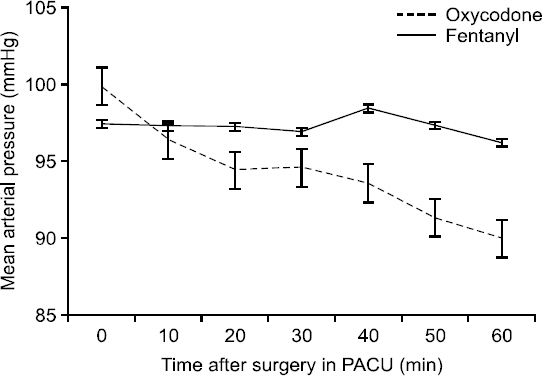
On the basis of the protocol, 56 women were included in the study. Demographic data were similar in the two groups (Table 1). The mean (± SD) consumption of opioid was 11.5 ± 4.8 mg in the oxycodone group and 0.184 ± 0.074 mg in the fentanyl group (Table 2). The length of time that elapsed before patients no longer demanded pain medication differed significantly between the two treatment groups (P = 0.0137) (Table 2), with mean durations of 36.4 ± 17.8 minutes for the oxycodone group and 50.2 ± 22.4 minutes for the fentanyl group (P = 0.013). In addition, the oxycodone group showed significantly less intense pain from the time they arrived in the PACU to the time they were moved to the ward (P = 0.0018) (Fig. 1). Mean arterial blood pressure (MAP) was checked every 10 minutes for 60 minutes while the patients were in the PACU and was found to decrease significantly more in the oxycodone group than in the fentanyl group (P = 0.0002) (Fig. 2).

Values on visual analog scale (0 = no pain; 10 = worst pain imaginable) in the fentanyl and oxycodone groups 0 to 60 minutes after surgery. Data are means and 95% confidence intervals. P = 0.0018, using repeated measures analysis of variance. PACU: post-anesthesia care unit.

Mean arterial pressure in the fentanyl and oxycodone groups 0 to 60 minutes postoperatively. Data are means and 95% confidence intervals. P = 0.0002, using repeated measures analysis of variance. PACU: post-anesthesia care unit.
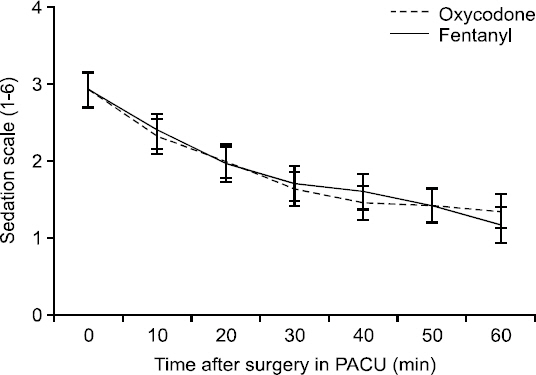
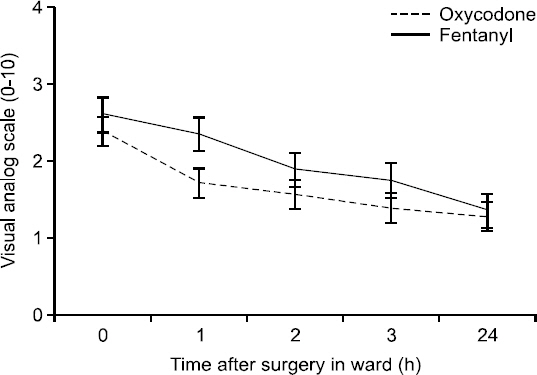
Values on the sedation scale were similar in the two groups (P = 0.28) (Fig. 3). No patient was excessively sedated in the PACU, although when they first arrived there, some patients showed a brisk response (sedation scale 4). During the 60 minutes in the PACU, all 56 patients were either cooperative, oriented, and calm (sedation scale 2) or anxious or restless (sedation scale 1). The mean VAS levels after arrival in the ward and for 24 hours thereafter were significantly lower in the oxycodone group than in the fentanyl group (P = 0.0068) (Fig. 4). There were no significant differences between the two groups in the incidence of side effects. Three patients in the oxycodone group and two in the fentanyl group experienced mild-to-moderate nausea, and one patient in the fentanyl group vomited; one patient in each group was treated for PONV.

Results on the sedation scale (1 = anxious, agitated, restless; 2 = cooperative, oriented, tranquil; 3 = responsive to command only; 4 = brisk response to light glabellar tap or loud auditory stimulus; 5 = sluggish response to light glabellar tap or loud auditory stimulus; 6 = no response to light glabellar tap or loud auditory stimulus) in the fentanyl and oxycodone groups 0 to 60 minutes postoperatively. Data are means and 95% confidence intervals. P = 0.28, using repeated measures analysis of variance. PACU: post-anesthesia care unit.
DISCUSSION
Oxycodone is one of the semisynthetic opioids that was developed in Germany in 1916. Derived from the opium alkaloid thebaine, it is structurally related to morphine and is used to relieve moderate to severe pain [6]. Like morphine, oxycodone appears to be a selective p-opioid–receptor agonist, and CYP3A-mediated N-demethylation is its principal metabolic pathway in humans [7]. Other studies have suggested that oxycodone works primarily at the central p-receptor and kappa (κ)-opioid receptors on peripheral nerves, which may be an important feature for antinociception in the visceral pain system. It has been suggested that oxycodone has an additional antinociceptive effect on κ-opioid receptors that is mediated by the κ2b-opioid receptor [8,9]. Nozaki et al. [10] have suggested that oxycodone’s effects are different under different circumstances. Specifically, although morphine had no effect on hyperalgesia in diabetic mice, the same dose of oxycodone produced marked antinociception, suggesting that the antinociceptive effects of oxycodone are mediated by κ-opioid receptors with p-opioid receptors in non-diabetic mice. A possible explanation for this effect is that oxycodone also has κ-opioid–receptor agonist properties; however, from this study, it could not be determined whether the effect of oxycodone was related to the κ-opioid receptors.
In a study of PCA by Howell et al. [2] in which fentanyl alone was used to maintain adequate analgesia, the PCA settings or supplemental boluses had to be readjusted several times in more than 70% of cases, as compared with 20% of patients who were receiving morphine for PCA. Moreover, the pharmacokinetic (PK) and pharmacodynamic (PD) simulations of fentanyl using the PK/PD software with a weight-scaled three-compartment PK model [3] and the effect site compartment model [11] showed delayed increases before of the effect site concentration reached a steady state during various fixed-amount infusions.
In a previous study, the analgesic potency between oxycodone and morphine for postoperative pain after surgery was presumed to be 1 : 1, with mixed somatic and visceral pain components [12,13]. For cancer pain, oxycodone seemed to be somewhat less potent than morphine when given intravenously [14]. However, some experimental studies have shown that the potency of oxycodone is superior to that of morphine in the management of visceral pain [15] and postoperative pain, with fewer side effects [16]. Also, Kalso et al. [17] suggested that the equianalgesic dose ratio of oxycodone to morphine was 2 : 3, as calculated based on total opioid consumption during a 2-hour period. But there are no safe recommendations regarding the direct conversion factor for intravenous oxycodone and intravenous fentanyl, as compared with that for intravenous fentanyl and intravenous morphine (1 : 100) [5]. We calculated a conversion factor of 1 : 100 based on our daily clinical practice and the recommended conversion factor for intravenous fentanyl to intravenous morphine [18].
To examine the analgesic effect of opioids in relation to plasma concentration, and to improve that relationship, we determined the minimum effective concentrations (MEC) or the minimum effective analgesic concentrations (MEAC). The MEC and MEAC of intravenous oxycodone in patients undergoing laparoscopic cholecystectomy were 20 to 35 ng/ml and 45 to 50 ng/ml, respectively [19]. In patients undergoing major abdominal surgery, the MEC and MEAC of fentanyl were 0.63 ng/ml and 0.6 to 1.0 ng/ml, respectively; the MEC and MEAC of oxycodone have not yet been elicited in such patients [19,20].
In previous studies, Choi [21] simulated the plasma concentrations and effective concentrations of oxycodone and fentanyl using a variable PCA regimen based on pharmacodynamic models of oxycodone [22] and fentanyl [23]. This simulation showed that the MEAC was reached most rapidly through immediate postoperative high-dose boluses and a continuous background infusion of PCA (Table 3). Although an oxycodone bolus of 0.1 mg/kg is better than just a 2-mg dose for immediate postoperative pain relief, additional rescue would be needed by at least 2 hours. To arrive at 90% steady-state concentrations most rapidly, a higher dose (0.1 mg/kg) combined with continuous background infusion was needed.
On the basis of this result, we instituted continuous background infusion PCA of oxycodone (0.02 mg/kg/h) or fentanyl (0.2 μg/kg/h) immediately after surgery. In order to ensure safe administration, the simulation doses were divided twice, 10 minutes before the end of surgery, and as soon as the patient arrived in the PACU, bolus doses of oxycodone (0.05 mg/kg) and fentanyl (0.005 mg/kg) were administered. Of course, the first evidence of pain having subsided would not coincide with the MEAC. Based on the point at which pain was relieved and on the consumption of opioids, we anticipated being able to compare the potency of different opioids.
In previous studies, the equianalgesic dose ratio of oxycodone and morphine was calculated to be 2 : 3 based on opioid consumption during a 2-hours study period [17]. Extrapolating from the conversion factors for fentanyl vs. morphine (1 : 100) and for oxycodone vs. morphine, the conversion factor of fentanyl vs. oxycodone would be 1 : 66. Likewise, in our study, the mean consumption values of the two opioids within 1 hour after surgery were 0.184 ± 0.074 mg of fentanyl and 11.5 ± 4.8 mg of oxycodone, and the ratio was 1 : 62. In other studies, the median intraoperative and postoperative consumption of oxycodone was 15 mg and the consumption of fentanyl was 0.2 mg. So the equianalgesic dose ratio is 3 : 4 based on the fentanyl versus oxycodone conversion factor (1 : 100) [5].
Also, the time elapsed until the pain first subsided was shorter by about 25% in the oxycodone group (36.4 ± 17.8 min) as compared with the fentanyl group (50.2 ± 22.4 min). Mean VAS levels during the hour spent in the PACU were lower in the oxycodone group, indicating that oxycodone has a more rapid onset and reaches the MEAC more quickly. From these results we could not be certain of the true conversion factor but could only estimate an approximate ratio. The onset of action is known to be similar for intravenous oxycodone and intravenous fentanyl, although oxycodone has a slightly longer duration of action when compared with fentanyl. Because fentanyl is redistributed more quickly than oxycodone, the analgesic effect of a single dose of fentanyl will probably be more short-lived. This could be reflected in the differences in mean VAS levels, which were lower in the ward (P = 0.0068) than in the PACU (P = 0.0018).
During the hour the patients were in the PACU, MAP decreased more in the oxycodone group than in the fentanyl group to a significant degree, presumably as a result of the more profound vasodilatation due to the release of histamine. Still, the change was within a safe range, so it did not threaten this vital sign.
In conclusion, oxycodone was more effective than fentanyl for postoperative analgesia when administered according to the previously recommended equianalgesic dose ratio (1 : 100), and there were no differences between the two groups in terms of side effects. One limitation of this study was that we did not have the time to check the amounts of opioid consumed and could therefore not derive the equianalgesic dose ratio precisely. Further studies should be performed to determine the true conversion factors for these two opioids.


