Influence of acute normovolemic hemodilution on the potency and time course of action of rocuronium in rabbits
Article information
Abstract
Background:
We performed this study to evaluate the potency and time course of rocuronium-induced neuromuscular block following moderate or severe acute normovolemic hemodilution (ANH) in rabbits.
Methods:
Forty five rabbits were randomly assigned to the control (C) group, the moderate ANH (M) group, or the severe ANH (S) group. After stabilization of sevoflurane anesthesia, ANH was achieved by drainage of arterial blood and an intravenous infusion of 6% hydroxyethyl starch, during which hematocrit (Hct) decreased to 26.2 ± 2.5% in the M group and 17.6 ± 2.2% in the S group. We determined dose-response relationships of rocuronium in the three groups and created a time course of the action of 0.6 mg/kg rocuronium.
Results:
The 50% effective dose (ED50) for rocuronium was 45% and 50% lower in the M and S groups, respectively, than in the C group (50.9 ± 6.3 μg/kg) (P < 0.001). The onset time after 0.6 mg/kg rocuronium was faster in the ANH groups compared with the C group (P < 0.001). The duration of neuromuscular block was prolonged by 38% and 43% in the M and S groups, respectively, compared with the C group (49.1 ± 6.9 min) (P < 0.001).
Conclusions:
ANH resulted in high potency, rapid onset, and prolonged duration of rocuronium. However, the severity of ANH did not alter the potency and duration of action of rocuronium.
INTRODUCTION
Autotransfusion is increasing in patients with expected massive blood loss and has a low rate of surgical site infection because there is no immunosuppressive effect in comparison to homologous transfusion [1]. There are several types of autotransfusion, including transfusion of patients’ own blood, which is collected before surgery (preoperative autologous blood donation), acute normovolemic hemodilution (ANH), and transfusion of collected blood during surgery using a cell saver, which collects red blood cells by centrifugation [2]. Even though ANH decreases allogeneic blood transfusion requirements because patients bleed in the diluted state, it is difficult to expect efficiency if hematocrit (Hct) is around 30%. If Hct is decreased to around 20%, damage of vital organs can be avoided and red blood cell loss can be reduced because of increased cardiac output, improvement of peripheral circulation due to low blood viscosity, and maintenance of a normal oxygen supply rate caused by right-shifting of the oxygen dissociation curve [3].
Rocuronium bromide (rocuronium) (Esmeron®, Korea MSD, Oss, The Netherlands) is a steroid-type nondepolarizing muscle relaxant, and its onset time is markedly faster than other nondepolarizing muscle relaxants [4]. After ANH, the duration and potency of succinylcholine, pancuronium, and tubocurarine increase [5]. The dose-response curves of vecuronium [6], atracurium [7], and rocuronium [8] are shifted to the left; further, duration and potency increase, but there are no effects on the dose-response curve and the duration of cisatracurium [9]. Published reports of muscle relaxant effects have evaluated the pharmacodynamics of muscle relaxants in moderate ANH (decrease in Hct 25%–28%), but there is no data on the effects of muscle relaxants in severe ANH (decrease in Hct below 20%), which is difficult to clinical trials [10].
Thus, we examined, in vivo, whether the severity of acute normovolemic hemodilution can alter the pharmacodynamics of rocuronium.
MATERIALS AND METHODS
After obtaining approval of the research for animal experiments committee, we randomly assigned 45 New Zealand White male rabbits that weighed 2.7 ± 0.3 kg (age: 14–15 weeks) to three groups. Without pretreatment, anesthetic induction was performed with a non-rebreathing coaxial system (Bain circuit), a face mask with 100% oxygen (oxygen flow rate of 200 ml/kg/min), and 8% sevoflurane (Sevoflo® Abbott Laboratories Ltd., Kent, UK). Once animals were at the adequate anesthetic depth (absence of reactions to external stimuli), an uncuffed 3 mm internal diameter endotracheal tube was introduced using a capnography guided as “blind technique” [11]. While using an animal respirator (SN-480-5, Shinano Co., Japan), rabbit lungs were ventilated at a tidal volume of 25 ml/kg, with a respiratory rate of 30–35 breaths/min and an inspiration time: expiration time (I:E) ratio of 1:2. End-tidal carbon dioxide was maintained at 30–35 mmHg with an ETCO2/SpO2 monitor (CO2SMO®, Novametrix Co., USA) while arterial blood gas analysis was performed intermittently using a GEM-STAT® gas analyzer (Mallinckrodt Co., USA). To observe end-tidal sevoflurane concentrations, a gas analyzer (Datex-Ohmeda S/5 Anesthesia Monitor; GE Healthcare Finland, Helsinki, Finland) was used with a sampling flow rate of 200 ml/min. Because the minimum alveolar concentration of sevoflurane is 3.7 ± 0.2% in a rabbit, the end-tidal sevoflurane concentration was maintained at 4% in order to maintain anesthesia [12].
All rabbits were maintained in the supine position, and the marginal ear vein was punctured with a 22 G catheter for continuous fluid supply and drug administration after induction of anesthesia. 0.9% normal saline was maintained at a rate of 6 ml/kg/h using an infusion pump (STC 523, Terumo Co., Japan). After insertion of a 22 G catheter into the right common carotid artery, a monitoring device (SpaceLabs®, 90603A®, SpaceLabs Co., USA) was used for continuous observation of the electrocardiogram and mean arterial blood, and intermittent arterial blood gas analysis was performed using a GEM-STAT® gas analyzer (Mallinckrodt Co., USA). The contralateral internal jugular vein was punctured with a 22 G catheter and flushed with 6% hydroxyethyl starch (Voluven®, Fresenius Kabi Deutschland GmbH, Germany), and rabbit rectal temperature was maintained at 38°C using a thermostat (Blanketrol II, 222, Cincinnati Sub-Zero Co., USA) and a heat lamp.
The tibialis anterior muscle was exposed and detached from the tibia. The distal part of the tibialis anterior ligament and the force displacement transducer (45196A®, San-ei Co., Japan) were tied with No. 3 silk. Physiological recording devices (Biophysiograph 7748®, San-ei Co., Japan) were then continuously connected to record the amount of muscle contraction while a resting tension of 20 g (preload) was applied on the tibialis anterior muscle.
The common peroneal nerve was exposed at the upper lateral knee joint and connected to electrodes with bipolar wire. Using a peripheral nerve stimulator (DualStim®, Life-Tech Inc., USA), train-of-four (TOF) stimulations performed every 10 seconds (s) with a 0.2 ms supramaximal square-wave stimulus were applied, the twitch responses of the tibialis anterior were recorded, and the first twitch after TOF stimulation were compared.
First study
Twenty-four rabbits were randomly divided into three groups (n = 8 each). In order to maintain the stability of the test animals, a 20 minutes acclimation period was used after completing all the operations. In the control group (C group), blood was not aspirated. In the moderate group (M group), 10 ml of blood was aspirated from the carotid artery every 10 minutes, and at the same time an equal volume of 6% hydroxylethyl starch was injected into the contralateral internal jugular vein; the Hct was repeatedly measured to reach the target Hct of 27%. In the severe group (S group), the experiment was performed as above with a target Hct of 18% [10]. The total amount of aspirated blood was 32 ± 2.8 ml (M group) and 67 ± 4.3 ml (S group). Continuous pulse rate and arterial pressure monitoring were performed during hemodilution. We were prepared to reinject aspirated blood if the Hct decreased below the target Hct, but that did not happen.
TOF stimulations were applied for 20 min at 10 s intervals. When muscle contraction was stable, we measured the height of the control twitch. The maximum inhibition rate of the first twitch was confirmed by comparing of the height of the control twitch after 40, 60, and 80 μg/kg of rocuronium in the C group, and after 20, 30, and 40 μg/kg of rocuronium in the M and S groups (Fig. 1). Each rocuronium dose was determined by a preliminary test in order to obtain an accurate dose-response curve. Dose-response curves were constructed using the inhibition ratio of the first twitch (in probit coordinates) and the dose of rocuronium (in logarithmic coordinates). We used a single-dose method because rocuronium has an intermediate duration of action. Dose-response curves were evaluated using analysis of covariance (ANCOVA); when inhibition of the twitch reached 50% and 95%, the effective doses (ED50 and ED95, respectively) were calculated in the dose response curve. All intravenous administrations of muscle relaxants were performed within 5 s. Each dose of rocuronium was withheld until the muscle twitch had recovered from the preceding dose, and had remained at baseline value for at least twice the duration of block of the preceding dose [13]. After the experiment ended, a lethal dose of potassium chloride was administered for euthanasia of all rabbits.
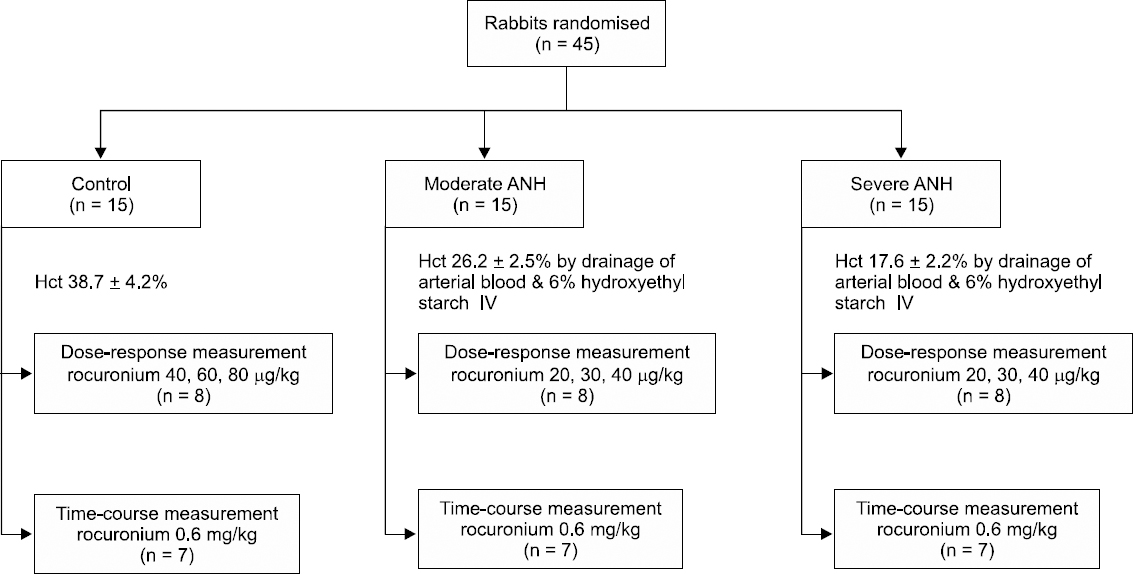
Study flow chart. ANH: acute normovolemic hemodilution, Hct: hematocrit, IV: intravenous.
Second study
Twenty-one rabbits were randomly divided into three groups (n = 7 each) and prepared in the same manner as in the first study. 0.6 mg/kg rocuronium was injected intravenously, and inhibition and spontaneous recovery of twitch were observed.
We measured the maximal suppressed time of the first twitch (onset time); reproduction of the first twitch; 25%, 75%, and 95% recovery time for the first twitch compared to the control twitch; and the time for the TOF ratio (T4/T1) of 0.9. The recovery index was defined as the time required for the first twitch to recover from 25% to 75% (Fig. 1). After the experiment ended, a lethal dose of potassium chloride was administered for euthanasia of all rabbits.
Statistical analysis
Statistical analysis was performed with the SPSS statistical software (version 17.0, SPSS Inc., Chicago, USA.). Linear regression analysis and one way analysis of co-variance (ANCOVA) were used to evaluate the results of the first study, slope and the ED50 and ED95 of muscle relaxant, respectively. The results of the second study were evaluated with ANOVA and the Bonferroni multiple range t-test for comparison between groups. All measurements were expressed as the mean ± standard deviation (SD). Results were judged to be statistically significant when the P value was less than 0.05.
RESULTS
Mean arterial pressure and heart rate were maintained at less than 15% of the control value in all rabbits. Normal body temperature was maintained and no rabbits died during the experiment. After ANH, hemoglobin and Hct were 12.9 ± 1.4 g/dl and 38.7 ± 4.2% in the C group, 8.7 ± 0.8 g/dl and 26.2 ± 2.5% in the M group, and 5.9 ± 0.7 g/dl and 17.6 ± 2.2% in the S group, respectively. There was a significant difference among the groups (P < 0.001, Table 1). After ANH, it was found that hemoglobin, Hct, potassium, ionized calcium, total plasma protein, and albumin had decreased in the M and S groups compared to the C group (P < 0.001, Table 1).

Arterial Blood Gas Data and Concentrations before and after Acute Normovolemic Hemodilution in Rabbits
First study
The ED50 of rocuronium was 50.9 ± 6.3 μg/kg, 27.8 ± 3.7 μg/kg, and 25.4 ± 3.5 μg/kg in the C group, M group, and S group, respectively. The ED95 of rocuronium was 87.4 ± 9.5 μg/kg, 51.1 ± 5.2 μg/kg, and 46.5 ± 4.8 μg/kg in the C group, M group, and S group, respectively. The ED50 and ED95 of rocuronium had decreased in the experimental groups (M and S groups) compared with the C group (P < 0.001), but there was no difference between the M group and the S group (Table 2). The slopes of the dose-response curve were 4.5 ± 0.5, 4.4 ± 0.7, and 4.4 ± 0.6 in the C group, M group, and S group, respectively. There was no significant difference among the groups, but dose-response curves were shifted to the left in the experimental groups compared to the C group (P < 0.001, Fig. 2).

Dose-Response Data of Rocuronium after Acute Normovolemic Hemodilution

Dose-response curves of rocuronium obtained by log dose-probit linear regression for twitch depression after acute normovolemic hemodilution (ANH) in rabbits. Individual points represent the mean (95% confidence intervals) twitch depression (% control) with each dose. Group C: control group (hematocrit, Hct 38.7 ± 4.2%), Group M: moderate ANH (Hct 26.2 ± 2.5%), Group S: severe ANH (Hct 17.6 ± 2.2%). *P < 0.001 compared with the control group.
Second study
The onset time was 0.7 ± 0.2 min, 0.4 ± 0.1 min, and 0.3 ± 0.1 min in the C group, M group, and S group, respectively, which was faster in the experimental groups compared with the control group (P < 0.001); there was no significant difference between experimental groups (Table 3). The recovery index (25%–75%) was 7.7 ± 2.7 min, 12.2 ± 3.5 min, and 12.8 ± 4.1 min in the C group, M group, and S group, respectively, which was prolonged in the experimental groups compared to the control group (P < 0.001). There was no significant difference between experimental groups (Table 3). Recovery time to TOF ratio of 0.9 was 49.1 ± 6.9 min, 68.9 ± 10.7 min, and 71.2 ± 12.9 min in the C group, M group, and S group, respectively, which was prolonged in the experimental groups compared with the control group (P < 0.001). There was no significant difference between experimental groups (Table 3).

Onset and Recovery Times (min) in Rabbits given Rocuronium 0.6 mg/kg after Acute Normovolemic Hemodilution
DISCUSSION
Hemoglobin, Hct, potassium, ionized calcium, total plasma proteins, and albumin had decreased in the experimental groups compared with the control group after ANH. The dose- response curve of rocuronium was shifted to the left (increased potency) in the experimental groups. After intravenous injection of 0.6 mg/kg rocuronium, the onset time became faster and the recovery time was prolonged, but there was no significant difference between experimental groups.
In this study, rabbits that underwent ANH were more sensitive to rocuronium than control rabbits. The ED50 of muscle relaxants was decreased after ANH as follows; succinylcholine (64%), pancuronium (60%), tubocurarine (53%) [5], vecuronium (22%) [6], atracurium (25%) [7] and rocuronium (42%) [8]. In this study, the ED50 of rocuronium had similarly decreased by 45% and 50% in the M and S groups, respectively, compared with the control group. The potency of muscle relaxants was influenced by the degree of protein binding with unbound muscle relaxant [7]. In this study, after ANH, it was found that plasma protein and albumin had decreased by 28% and 34% in the M group and by 43% and 53% in the S group, respectively. Wierda and Proost [14] reported that the protein-bound fraction of rocuronium is 25%, while Roy and Varin [15] reported that the protein-bound fraction of rocuronium is 46%. If protein binding of rocuronium decreases due to ANH, the plasma concentration of unbound rocuronium will be increased compared with the control group. Accordingly, more rocuronium will be available for receptor binding, which should lead to a left shifting of the dose-response curve. However, changes in the dose- response curve are caused by not only the amount of unbound muscle relaxant, but also the blood-brain equilibration rate constant (Keo) and changes in the volume of distribution [16]. Except for drugs with a very high binding strength, changes in plasma protein binding have limited clinical effects [17]. Potassium and ionized calcium in the plasma play an important role in the migration of acetylcholine in the neuromuscular junction, and also affect the reaction to muscle relaxants [18]. After ANH, the M and S groups showed decreased potassium (22% and 33%) and ionized calcium (15% and 22%), respectively, compared with the control group. We suspect that these results may influence the increased potency of the muscle relaxant. The Hct of the M and S groups were different, but there were no differences in the left shift of the dose-response curve in the M and S groups. We do not know the reason of no differences between the M and S groups. We suspect that this left shift is due to complex ANH-induced changes rather than differences in Hct only, but this hypothesis needs the further study with increasing the number of objects.
ANH increases cardiac output in humans, blood flow in skeletal muscle by 27% in dogs, and increases skeletal muscle redistribution of blood via capillary flow [19]. In rabbits and hamsters, even when Hct is reduced by 11 ± 1.4% using ANH with 6% dextran solution, tissue blood circulation is maintained, presumably due to the compensatory effect of erythrocyte-associated transients [20]. Increased skeletal muscle blood flow and an increase in cardiac output after ANH promote the onset of rocuronium by increasing the initial distribution, which can be observed in the significantly faster onset time of rocuronium in this study. After ANH, the volume of distribution of rocuronium had increased, plasma clearance was reduced, and distribution and clearance half-life had decreased [8]. The effects of muscle relaxants such as rocuronium are determined by the distribution periods rather than the clear periods [21]; therefore, we expected that reducing plasma concentration by increasing the volume of distribution would decrease the duration of rocuronium. These findings are inconsistent in the current study, but on the other hand, they are consistent with previous results [6-8]. After ANH, the duration of vecuronium, atracurium, and rocuronium had increased by 32%, 33%, and 28%, respectively, due to an increase in muscle relaxant potency, hemodynamic changes, and changes in plasma electrolytes [6-8]. We suspect that the duration is not significantly influenced by the change in volume of distribution.
The cumulative dose method is used in clinical trials to obtain the dose-response curve of rocuronium, which has an intermediate duration of action [6-9], but the potency of the drug may be underestimated due to rapid distribution and metabolism of this muscle relaxant [22]. Therefore we used a single dose method in this study. In rabbits, the ED50 and ED95 (mean [95% confidence intervals]) of rocuronium are 61.5 (56.2–66.8) μg/kg and 95.1 (88.4–101.8) μg/kg, respectively [23]. Kim et al. [13] also reported that the ED50 is 48.1 (44–52.2) μg/kg or 56.5 (51.2–61.8) μg/kg [24] in the rabbit, respectively, which is 40% of the ED50 in humans [25]. We also obtained similar results (50.9 [44.6–57.2] μg/kg). In our study, after the administration of rocuronium 0.6 mg/kg, onset and TOF (0.9) were 0.7 ± 0.2 min and 49.1 ± 6.9 min, respectively (Table 3). We suspect that this relatively rapid onset and delayed recovery were due to the larger dose (7 × ED95) in rabbits than that (2 × ED95) used in the human investigation.
The total blood volume of the rabbit is 80 ml/kg [26]. If 25 (20–30) ml and 64 (53–75) ml of blood were drawn and simultaneously replenished with equal amounts of 10% pentastarch, hemoglobin would decrease to 9.2 g/dl and 6.5 g/dl, respectively [26]. In this study, we drew blood (32 [29.2–34.8] ml and 67 [62.7–71.3] ml) in the M and S group, respectively, and replenished it with equal amounts of 6% hydroxyethyl starch. Hct was decreased to 26.2 (23.7–28.7)% and 17.6 (15.4–19.8)% in the M and S group, respectively.
One limitation of this study was the maintenance of anesthesia with sevoflurane. Because inhalation anesthesia is more widely used than intravenous anesthesia in clinical situations, we used sevoflurane in order to achieve a similar environment. However, sevoflurane delays the recovery from rocuronium compared with intravenous anesthesia [27], and tends to delay it but not significantly [28]. Even though this trial has been implemented in the same environment in each group, sevoflurane may have affected recovery from rocuronium. Another limitation was that we have to test a small number of rabbits in order to reduce the sacrifice of the animal. If the number of rabbits was increased after a measurement of sample size, the significant results may be obtained.
In conclusion, ANH increased the potency and prolonged the duration of rocuronium in rabbits. However, the severity of ANH did not alter the potency and action duration of rocuronium.