Changes of the T-wave on range of spinal blockade after low dose epinephrine administration
Article information
Abstract
Background:
Epidural test solution is administered to confirm the correct positioning of an epidural catheter. Hemodynamic changes after administration of epidural test solution reportedly help confirm intravenous (IV) placement of epidural catheters. The change in T wave amplitude is important for checking intravascular placement of epidural catheters. We examined changes in T wave amplitude according to the level of spinal anesthesia after IV epinephrine administration.
Methods:
Eighty-one healthy patients undergoing spinal anesthesia were randomized into three groups: group C (control), group L (low spinal block), and group H (high spinal block). All patients received an IV administration of test solution, 3 ml of 1% lidocaine and epinephrine 10 μg. Systolic blood pressure (SBP), heart rate (HR), and T wave amplitude were measured up to 5 min after test solution administration. Adverse reactions post administration of test solution were also recorded.
Results:
In all groups, after administration of IV test solution, SBP and HR increased, and the T wave amplitude decreased. There were no significant differences in HR, SBP, and T wave amplitude changes between the groups after administrating test solution. Fifteen out of 25 patients (60.0%), 10 out of 24 (41.6%), and 11 out of 23 (47.8%) complained of adverse symptoms in groups C, L, and H, respectively.
Conclusions:
This study suggests that change in T wave amplitude after administration of a low dose of epinephrine is not affected by the spinal block range.
INTRODUCTION
Anesthesiologists may choose to combine the rapid onset and reliable dense block of spinal anesthesia with post-operative analgesia of an epidural block [1]. However, accidental malposition of the catheter may result in serious complications. Large volumes of local anesthetics injected intravascularly can result in significant toxicity and lead to adverse events such as seizures, coma, respiratory depression, and cardiovascular collapse. Therefore, the conventional epidural test solution, 3 ml of 1.5% lidocaine with 1 : 200,000 epinephrine, helps confirm the correct positioning of epidural catheters by monitoring objective hemodynamic changes [2].
The hemodynamic response, including heart rate (HR) and systolic blood pressure (SBP), to the administration of epidural test solution is affected by several factors. Aging [3], previous administration of beta (β)-adrenergic blocking drugs [4], combination of midazolam and fentanyl [5], volatile anesthetics [6], and spinal block are factors that affect HR. While SBP is affected by isoflurane and spinal or high thoracic epidural anesthesia, it is unaffected by aging [3], β-adrenergic blocking drugs [4], sevoflurane [6], and low thoracic epidural anesthesia.
Tanaka et al. [7] proposed that epidural test solutions containing epinephrine change the T wave on electrocardiogram (ECG), and that these ECG changes are induced by the administration of low doses of epinephrine during general anesthesia. Lee et al. [8] also reported similar results in spinal anesthetic patients. These studies suggest that monitoring T wave changes may constitute an approach for the detection of unintentional intravenous (IV) administration of epinephrine- containing solution. It has been reported that T wave amplitude is unaffected by the administration of epinephrine in general anesthesia using sevoflurane [9]. However, the effect of epinephrine administration in spinal anesthesia has not yet been evaluated.
In this study, we examined the effect of a range of spinal block on the T wave amplitude in ECG after the IV administration of a low dose of epinephrine.
MATERIALS AND METHODS
After obtaining approval from the Institutional Review Board and informed consent, we enrolled 81 patients with an American Society of Anesthesiologists physical status classification I aged between 18 and 65 years. Written informed consent was obtained from all patients scheduled to undergo spinal anesthesia for elective surgery. The patients were randomized into three groups in a double-blinded fashion: control (group C), low level block (group L), and high level block (group H). After spinal block, patients with a SBP below 80 mmHg or a HR below 50 bpm, and an incomplete block (block less than T12 level) were excluded. Nine patients were excluded prior to examination due to incomplete block (n = 6) and severe bradycardia (n = 3) (< 50 bpm). Therefore, a total of 72 patients were included in this study. Patients in group C (n = 25) did not undergo spinal nerve block. Patients in group L (n = 24) underwent sensory block below T10 level and those in group H (n = 23) received sensory block above the T6 level.
None of the patients was administered any premedication. An ECG using five electrodes monitored noninvasive blood pressure and pulse oxymetry (Datex-Ohmeda S/5, Helsinki, Finland). Patients in group C without spinal block remained in the resting state for 5 min. Spinal anesthesia was performed using hyperbaric bupivacaine via a 25-gauge Quincke needle at the L3–4 or L4–5 interspace. For patients in groups L and H, the solution contained 10 mg and 14–15 mg bupivacaine, respectively. The level of block was evaluated by the pinprick test 30 min after subarachnoid administration of bupivacaine. Baseline SBP and HR values were measured, and a baseline ECG (standard lead II) exceeding 5 s was obtained. The test solution was administered via forearm veins for 5 s. The solution comprised 3 ml of 1.0% lidocaine and 10 μg epinephrine in all groups, and was administered after baseline measurements in the control group or after checking block level in groups H and L. The ECG was printed at 20 s intervals for the first 2 min and at 5 min after the administration of test solution. SBP was measured every minute for 5 min. In addition, we inquired about patient symptoms such as chest discomfort, palpitations, dizziness, and uneasiness.
The ECG print was set up as 1.0 mV/cm and 25 mm/s. There was no time lag between the waveform on the monitor and the printing waveform. The printed ECG was copied at 200% size. The size of the T wave amplitude was measured on the basis of the copied ECG and comprised the average T wave height in three cardiac cycles closed to each time. Heart rate was measured from the average of two R-R intervals collected from three consecutive cardiac cycles.
Data were presented as mean ± standard deviation and the pin-prick test values were presented as the median (25th percentile, 75th percentile). Statistical analysis was performed using the software SigmaStat (v. 3.5, Jandel Scientific Software, San Jose, CA, USA). The data were compared using the one way repeated measured analysis of variance (ANOVA) within a group and with the one way ANOVA for between group comparisons. If there were any differences, the Turkey test, adjusting for multiple testing post-hoc, was subsequently used to identify differences. P values < 0.05 were considered statistically significant.
RESULTS
Demographic data and sensory block levels are shown in Table 1. SBP, HR, and T wave amplitude are presented in Table 2. SBP statistically increased at 1 and 2 min in group C, at 2 min in group L, and at 2 and 3 min in group H. HR statistically increased at all time intervals in group C, at 20, 40, 60, and 80 s in group L, and at 40 and 60 s in group H. The T wave amplitude statistically decreased at 20, 40, 60, and 80 s in group C, at all time intervals except 300 s in group L, and at 40, 60, 80, 100, and 120 s in group H after administration of IV test solution (Table 2).

Demographic Data and Level of Sensory Block

Values before and after Simulated Test Solution
The baseline SBP values in group C were higher than in group H (P = 0.007). However, there was no statistical difference between groups C and L. Peak SBP values after administration of IV epinephrine were recorded at 1 min in group C and at 2 min in groups L and H. The peak SBP value in group C was higher than in group H (P = 0.028) (Table 3). Baseline HR in group L was lower than in groups C and H (P = 0.016). At 40 s after administration of IV epinephrine, all groups reached peak HR; however, there was no statistical difference in peak HR values between groups (Table 3). There were no statistical difference in baseline and minimal T wave amplitude values between groups. In addition, there was no significant difference in HR and SBP changes, and percentage change of T wave amplitude after administration of IV test solution among groups (Figs. 1–3).

Change Values before and after Test Solution
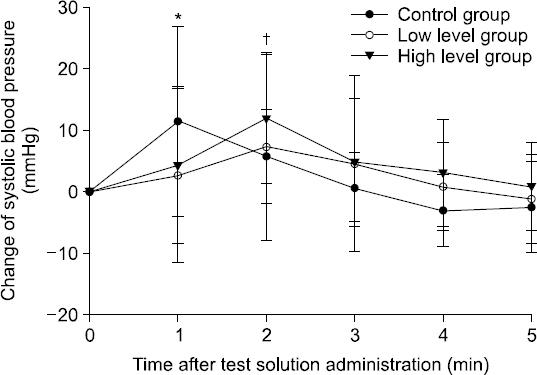
Changes in systolic blood pressure. Values are mean ± SD. There is no statistically significant differences between groups. *P < 0.05 compared with baseline time (0 s) in group C, †P < 0.05 compared with baseline time (0 s) in group H.

Percentage change in T wave amplitude. Values are mean ± SD. There is no statistically significant differences between groups. *P < 0.05 compared with baseline time (0 s) in group C, †P < 0.05 compared with baseline time (0 s) in group L, ‡P < 0.05 compared with baseline time (0 s) in group H.

Changes in heart rate. Values are mean ± SD. There is no statistically significant differences between groups. *P < 0.05 compared with baseline time (0 s) in group C, †P < 0.05 compared with baseline time (0 s) in group L, ‡P < 0.05 compared with baseline time (0 s) in group H.
Fifteen out of 25 patients, 10 out of 24, and 11 out of 23 complained of adverse symptoms in group C, group L, and group H, respectively (Table 4). In general, most of the subjective symptoms were minor and transitory. Furthermore, major complications such as cardiac arrest and severe hypertension did not occur.

Symptoms by Administration of the Epinephrine Test Solution
DISCUSSION
We evaluated the effect of spinal anesthesia on T wave amplitude after IV administration of a low dose of epinephrine. This study showed that there was no relationship between T wave amplitude changes and level of spinal block.
It is important to confirm the correct position of an epidural catheter during combined spinal and epidural anesthesia in order to prevent life-threatening complications such as IV injection of anesthetics. The inability to aspirate blood from an epidural catheter does not ensure intravascular migration of the epidural catheter [10]. To ascertain the correct position of catheters, the epidural test dose is administered via an indwelling epidural catheter [2]. Hemodynamic parameters are commonly used to evaluate the position of indwelling epidural catheters. However, since it is difficult to check the correct position with hemodynamic monitoring alone in some patients, such as parturients, assessing changes in the T wave can be a useful approach. Therefore, we studied the effectiveness of monitoring the T wave on ECG.
Spinal block by local anesthetics is accompanied with a block of sympathetic activity and alterations to the patient’s hemodynamics such as HR, blood pressure, and cardiac rhythm. These changes are regulated by the net balance between sympathetic and parasympathetic activity. Power spectral HR analysis during low thoracic bupivacaine spinal anesthesia is compatible with reduced sympathetic activity during stable hemodynamic intervals [11]. Changes in HR variability parameters during the course of spinal anesthesia may reduce sympathetic activity and relatively increase parasympathetic activity as a result of the block. In our study, the baseline and peak SBP values in group H were lower than in group C without sympathetic block. However, there were no statistical differences in HR values between groups C and H. This result was difficult to explain using the differences in the level of sympathetic block between groups. The responses to the circulating adrenergic activity may not be affected by spinal block. This differs from a report showing that spinal anesthesia reduces hemodynamic responses to IV epinephrine injection [12]. However, Liu et al. reported that epinephrine injection is unlikely to reduce detection by positive SBP and HR criteria [12]. We believe that this discordance can be explained by methodological variations between these studies. We did not evaluate the power spectral HR analysis or the changes in HR variability [13]. Therefore, we were not able to confirm the difference of autonomic block between the high and low spinal block groups; this comprises a major limitation of our study.
It is believed that spinal block does not affect hemodynamics or T wave amplitude. T wave criteria has been suggested to be a more sensitive indicator than hemodynamic criteria after administration of epinephrine [7]. The amplitude of hemodynamic changes and ECG responses post epinephrine administration may be attenuated by the following factors: aging [3], previous administration of β-adrenergic blocking drugs [4], the combination of midazolam and fentanyl [5], volatile anesthetics [6], spinal block [12], or high (T5) thoracic epidural anesthesia combined with general anesthesia [14]. It has been reported that the change in T wave amplitude is unaffected by the combination of midazolam and fentanyl [5], sevoflurane anesthesia [9], and the ECG lead monitored [15]. The change in T wave amplitude after administration of epinephrine has also be shown to be unaffected by sevoflurane anesthesia [9]. However, it is still unclear whether change in T wave amplitude is affected by the level of spinal block. In the present study, we selected 10 μg of epinephrine. This is because the combined sensitivity and positive predictive value of 100 could only be achieved with the positive T wave amplitude change after administration of 10 μg epinephrine [7,16]. It is reasonable for epinephrine to be systemically administered because extensively exposure to epinephrine is not associated with serious side effects [17]. Administration of 10 μg epinephrine may be able to reduce the risk of complications compared with the conventional epinephrine dosage (15 μg). In the present study, patients reported mild subjective symptoms. The most common symptoms, in descending order of frequency, generally comprised mild chest discomfort, palpitations, dizziness, and uneasiness (Table 4). Some patients complained of two or more symptoms almost simultaneously; however, no serious complications occurred.
The pathophysiological basis behind the reduction in T wave amplitude has not been explored. One of the most reliable hypotheses is that the change in T wave amplitude is caused by hypokalemia [18] or stimulation of β-adrenaline receptors [19]. Epinephrine can induce hypokalemia with resultant T wave changes on ECG [20]. However, in this study, since the epinephrine administering period was shortened to 5 s and the size of T wave decreased transiently, the T wave change may not be associated with hypokalemia, instead it may be due to the stimulation of cardiac β-adrenaline receptors.
There were some limitations regarding the T wave amplitude index. It is not easy to detect small or abnormal T waves with the naked eye without an enlarged ECG scale. Therefore, further studies will be required to ascertain the clinical utility of ECG monitoring.
In conclusion, this study suggests that the change in T wave amplitude following administration of low doses of epinephrine is not affected by a range of spinal block.