


INTRODUCTION
Central venous pressure (CVP) and pulmonary artery occlusion pressure (PAOP) are widely used as pressure parameters in clinical practice. Accurate measurement of these pressures is the first step to improve the quality of hemodynamic management. Both CVP and PAOP are electronically measured by a fluid filled system with a transducer. To eliminate the influence of hydrostatic pressure, proper transducer levels should be at the uppermost fluid level in the chamber or the vessel in which pressures are being measured [1-3]. However, errors associated with inaccurate transducer placement commonly occur and this may lead physicians to make incorrect decision about treatment [4]. In clinical practices, patients may be placed in various positions such as supine or prone positions. These various positions can make placing the transducer at accurate level more difficult.
Accurate placement of a transducer is more important for parameters with a low normal value (i.e., CVP), compared to pressure of a high normal value (i.e., systemic arterial blood pressure). Thus, it is important that the CVP or PAOP transducer be placed at the proper level to accurately measure the pressure.
There are several studies to verify the proper transducer level for adult patients in the supine position [5-7]. Recently, optimal level of the reference transducer for CVP and PAOP in various positions were suggested for adults [8]. However, studies have not been conducted to assess the appropriate transducer level for pediatric patients. Moreover, there are no evidence-based reference transducer levels for pediatric patients in the supine and prone positions.
This study was performed to investigate optimal transducer levels for the accurate measurement of the right atrial pressure and left atrial pressure in the supine and prone positions in pediatric patients by reviewing their chest computed tomography (CT) images.
MATERIALS AND METHODS
The Institutional Review Board (No. 1501-118-644) approved the study. The patientsŌĆÖ informed consents were waived by the IRB. Chest CT data of pediatric patients aged 10 years and younger were reviewed by an investigator. The chest CT scans were performed using the following multidetector scanners: the Somatom Definition, Sensation 16 (Siemens Medical Solutions, Germany), Brilliance 64 (Phillips Medical Systems, The Netherlands), and Discovery CT 750HD (GE Healthcare, USA). Patients with a history of cardiothoracic surgery, congenital heart disease, any abnormal intra-thoracic and intra-abdominal lesion that influence heart position, chest wall or spinal deformities, and poor CT image quality were excluded.
The following data was recorded from the transverse section images: anteroposterior (AP) diameter of the thorax, the uppermost blood and the most posterior levels of the right atrium (RA) and the left atrium (LA) for the supine and prone position respectively. The patientsŌĆÖ characteristics including age, gender, height, and weight were collected.
A CT section with the uppermost blood level of the RA and the LA was selected for the supine position. We then measured vertical distances from the skin on the back to the uppermost blood level of each atrium on the selected CT section in order that obtain the uppermost RA and LA height in supine position (RAsupine and LAsupine) (Fig. 1A).
Fig.┬Ā1
(A) Measurement of the uppermost blood level of the right atrium (RA) and the left atrium (LA) for supine position. RAsupine = the vertical distance from the skin on the back to the most anterior blood level of the RA; LAsupine = the vertical distance from the skin on the back to the most anterior blood level of the LA. (B) Measurement of the uppermost blood level of the RA and LA for prone position. RAprone = the vertical distance from the skin on the anterior chest wall to the most posterior portion of the right atrium; LAprone = the vertical distance from the skin on the anterior chest wall to the most posterior blood level of the LA. AP: anteroposterior.
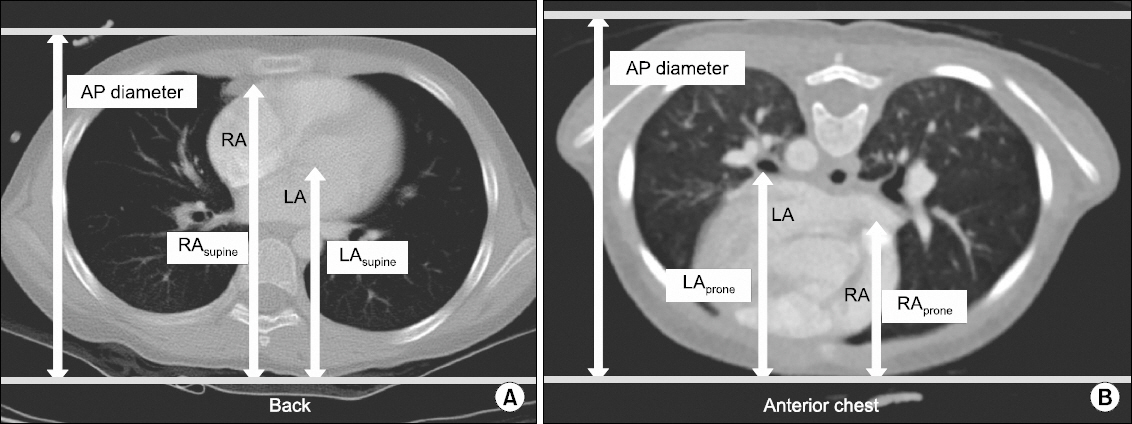
We assumed that the most posterior blood level of the atrium was optimal for transducer position in the prone position, because the most posterior blood level of the atrium on the CT image is the uppermost blood level in the prone position. We measured vertical distances from the skin on the anterior chest wall to the most posterior blood level of each atrium to investigate the uppermost RA and LA height in the prone position (RAprone or LAprone) (Fig. 1B).
Additionally, we measured the largest AP diameter of the thorax. The largest AP diameter of the thorax was measured vertically from the skin on the back to the skin on the mid-sternum to calculate the ratio of RAsupine to AP diameter of the thorax (RAsupine/AP) and the ratio of LAsupine to AP diameter of the thorax (LAsupine/AP). The ratio of RAprone or LAprone to the largest AP diameter of the thorax was calculated and abbreviated as RAprone/AP or LAprone/AP.
To evaluate the influence of age on the optimal transducer level, patients were divided into five groups: neonates under 1 month, infants aged 1 to 6 months, 6 to 12 months, children aged 1 to 5 years, and 5 to 10 years. The paired t-test was used for comparison of the followings: the uppermost blood level of both atria and its ratios in the supine and prone position. Analysis of variance (ANOVA) was used to compare the difference in each ratio between age groups. In addition, we defined the clinically significant differences as those greater than 5%. Linear regression analysis was performed to evaluate the relationship between age and each atrial level and its ratio. All data was expressed as mean ± SD unless otherwise specified. A P value less than 0.05 was considered statistically significant. Statistical analysis was performed using IBM® SPSS® Statistics 21 (SPSS Inc., IBM Corporation, USA).
RESULTS
The chest CT images of 213 pediatric patients were analyzed. The demographic data was described in Table 1.
Table┬Ā1
Patient Characteristics
| < 1 mo | 1-6 mo | 6-12 mo | 1-5 yr | 5-10 yr | Total | |
|---|---|---|---|---|---|---|
| Number of patient | 15 | 50 | 49 | 49 | 50 | 213 |
| Sex (M/F) | 8/7 | 29/21 | 32/17 | 29/20 | 28/22 | 126/87 |
| Age* | ŌĆā8.2 ┬▒ 9.9 dŌĆā | 3.9 ┬▒ 1.4 mo | ŌĆā9.2 ┬▒ 2.0 moŌĆā | 2.1 ┬▒ 1.0 yr | ŌĆā7.4 ┬▒ 1.4 yrŌĆā | 29.5 ┬▒ 35.2 mo |
| Weight (kg)* | 3.3 ┬▒ 0.5 | 6.0 ┬▒ 1.7 | 8.3 ┬▒ 1.5 | 11.6 ┬▒ 2.8 | 23.6 ┬▒ 5.7 | 11.8 ┬▒ 7.7 |
| Height (cm)* | 49.8 ┬▒ 2.3 | 61.4 ┬▒ 7.4 | 70.7 ┬▒ 5.1 | 86.0 ┬▒ 9.8 | 120.5 ┬▒ 9.7 | 82.2 ┬▒ 24.8 |
| AP diameter of thorax (mm)* | 89.7 ┬▒ 5.7 | 101.2 ┬▒ 9.5 | 109.8 ┬▒ 7.3 | 121.7 ┬▒ 9.5 | 151.2 ┬▒ 13.4 | 118.8 ┬▒ 22.3 |
| Sternal length (mm)* | 48.4 ┬▒ 9.5 | 62.5 ┬▒ 0.90 | 70.9 ┬▒ 14.6 | 80.5 ┬▒ 19.1 | 108.8 ┬▒ 23.4 | 78.4 ┬▒ 25.6 |
RAsupine and LAsupine increased with age (Table 2). The mean of RAsupine/AP was within the range of 80-85%, whereas the mean of LAsupine/AP was 60-65% from the back (Table 2, Fig. 2). The difference between RAsupine and LAsupine increased according to age, with the relationship of the difference = 21.83 ’╝ŗ 0.14 ├Ś age (month).
Table┬Ā2
Measurements on Chest Computed Tomography
| < 1 mo | 1-6 mo | 6-12 mo | 1-5 yr | 5-10 yr | Total | |
|---|---|---|---|---|---|---|
| RAsupine (mm)* | 72.8 ┬▒ 4.2 | 82.1 ┬▒ 8.2 | 92.2 ┬▒ 6.3 | 103.4 ┬▒ 8.0 | 128.1 ┬▒ 9.8 | 99.5 ┬▒ 19.8 |
| RAsupine/AP (%)* | 81.3 ┬▒ 4.4 | 81.2 ┬▒ 3.8 | 84.0 ┬▒ 3.7 | 85.0 ┬▒ 3.3 | 84.9 ┬▒ 3.3 | 83.6 ┬▒ 3.9 |
| LAsupine (mm)* | 55.1 ┬▒ 3.9 | 61.8 ┬▒ 6.9 | 67.7 ┬▒ 5.6 | 75.7 ┬▒ 6.2 | 94.5 ┬▒ 8.9 | 73.6 ┬▒ 14.7 |
| LAsupine/AP (%) | 61.6 ┬▒ 5.2 | 61.1 ┬▒ 2.9 | 61.6 ┬▒ 3.3 | 62.2 ┬▒ 2.4 | 62.5 ┬▒ 2.8 | 61.8 ┬▒ 3.1 |
| Distance between RAsupine and LAsupine (mm)* | ŌĆā17.7 ┬▒ 3.8ŌĆā | 20.2 ┬▒ 3.4 | ŌĆā24.5 ┬▒ 3.3ŌĆā | 27.7 ┬▒ 4.2 | ŌĆā33.6 ┬▒ 5.6ŌĆā | 25.9 ┬▒ 6.7 |
| RAprone (mm)* | 44.5 ┬▒ 5.3 | 50.0 ┬▒ 5.9 | 54.5 ┬▒ 4.4 | 59.6 ┬▒ 5.9 | 70.9 ┬▒ 7.8 | 57.7 ┬▒ 10.3 |
| RAprone/AP (%)* | 49.6 ┬▒ 4.9 | 49.4 ┬▒ 3.8 | 49.6 ┬▒ 3.0 | 49.0 ┬▒ 3.1 | 46.9 ┬▒ 3.0 | 48.8 ┬▒ 3.5 |
| LAprone (mm)* | 52.8 ┬▒ 5.0 | 59.1 ┬▒ 6.0 | 63.5 ┬▒ 4.7 | 70.7 ┬▒ 6.6 | 85.8 ┬▒ 8.8 | 68.6 ┬▒ 12.6 |
| LAprone/AP (%) | 58.8 ┬▒ 3.6 | 58.5 ┬▒ 3.5 | 57.9 ┬▒ 3.2 | 58.0 ┬▒ 2.6 | 56.7 ┬▒ 3.1 | 57.9 ┬▒ 3.2 |
| Distance between RAprone and LAprone (mm)* | 8.3 ┬▒ 3.0 | 9.1 ┬▒ 2.8 | 9.1 ┬▒ 3.0 | 11.1 ┬▒ 4.1 | 14.9 ┬▒ 4.6 | 10.9 ┬▒ 4.4 |
Fig.┬Ā2
Influence of age on RAsupine/AP and LAsupine/AP. RAsupine/AP r2 = 0.059 (P < 0.001); LAsupine/AP r2 = 0.018 (P = 0.052). Asupine/AP = ratio of vertical distance from the skin on the back to the most anterior blood level of the RA to the largest AP diameter of the thorax in supine position; LAsupine/AP = ratio of vertical distance from the skin on the back to the most anterior blood level of the LA to the largest AP diameter of the thorax in supine position. RA: right atrium, AP: anteroposterior, LA: left atrium.

RAprone and LAprone also increased with age (Table 2). RAprone and LAprone were placed at approximately half of the largest AP diameter of the thorax. The ranges of the mean RAprone/AP and the mean LAprone/AP were 45-50% and 55-60%, respectively, from the anterior chest (Table 2, Fig. 3). The difference between RAprone and LAprone increased according to age, with the relationship of the difference = 8.93 ’╝ŗ 0.07 ├Ś age (month).
Using ANOVA to compare the difference between age subgroups showed statistical significance in RAsupine/AP, (P < 0.001) and RAprone/AP (P < 0.001). However, each difference between age groups was within the range of 5%.
Fig.┬Ā3
Influence of age on RAprone/AP and LAprone/AP. RAprone/AP r2 = 0.084 (P < 0.001); LAprone/AP r2 = 0.043 (P = 0.002). RAprone/AP = ratio of vertical distance from the skin on the anterior chest wall to the most posterior blood level of the RA to the largest AP diameter of the thorax; LAprone/AP = ratio of vertical the skin on the anterior chest wall to the most posterior blood level of the LA to the largest AP diameter of the thorax. RA: right atrium, AP: anteroposterior, LA: left atrium.

DISCUSSION
We investigated how to re-position the transducer for CVP and PAOP monitoring depending on patientsŌĆÖ position using the chest CT images in pediatric patients.
According to our study, when measuring RA pressure in the supine position, the reference transducer should be placed at 80-85% of the AP diameter of the thorax. Whereas, when measuring LA pressure in the supine position, the reference transducer should be placed at 60-65% of the AP diameter of the thorax. There were significant differences between RAsupine and LAsupine, and we found a mean difference of approximately 2.6 cm between the uppermost blood levels of both atria in the supine position. The distance between RAsupine and LAsupine increased with age. Therefore, we should take into account these differences, if a transducer is used for measuring both CVP and PAOP.
In the prone position, we recommend the transducer position for both atria to be at approximately 50% of the AP diameter of the thorax for practical reason as the two ratio are almost close to 0.5 (RAprone/AP 0.49, LAprone/AP 0.58). These ratios were similar to those from adults [8]. According to our study, the mean difference between RAprone and LAprone, was approximately 1.1 cm in the prone position.
For adult patients, various external reference levels have been proposed for measuring CVP in the supine position. In practice, the most commonly used methods for setting the zero reference level in the supine position are 5 cm below the anterior thorax surface, 1/3 of the thoracic diameter below the anterior thorax surface, the mid-thoracic level, and 10 cm above the table level [6,9,10]. However, there is no consensus on a standard zero reference level. Our results in the supine position are consistent with the previous study in which the uppermost blood levels of both atria are four-fifths of the AP diameter for the RA and three-fifths for the LA from the skin on the back in adult [7,8]. The average distances from the mid-thoracic level to RAsupine and LAsupine were 40.0 mm and 14.1 mm respectively. This difference result in erroneous pressure measurement of 3.04 mmHg and 1.07 mmHg.
This study has several limitations. First, our data did not include differences according to specific respiratory phases. CVP should be measured in the end-expiratory phase of ventilation to avoid the influence of alterations in intra-thoracic pressure and we should consider this when estimating CVP. Second, the results of the neonates under 1 month group are limited, considering the relatively small number of the patients in this group (n = 15). We had difficulty obtaining sufficient chest CT images of neonates, because neonates rarely have chest CT images unless they have a congenital heart disease or congenital malformation of chest wall at birth. Third, we used chest CT images taken in supine position for the uppermost blood level in the prone position. Therefore, we should consider possible error in the prone position due to movement of the heart in the thoracic cavity and high chest wall compliance in children.
Despite some limitations, our study can provide an important evidence because there are no previous studies on the level of the reference transducer in pediatric patients.
In conclusion, the optimal levels of the reference transducer for accurate measurement of the CVP and PAOP seem to be at four-fifths and third-fifth of the AP diameter of the thorax in the supine position, and at a half and at third-fifths of that in the prone position, respectively, in children. The influence of age was minimal on the level of each transducer.


