


INTRODUCTION
Caudal block is one of the most commonly performed regional anesthesia procedures in children. It is useful as an adjunct to general anesthesia and postoperative pain control. Although it has its benefits, such as ease of performance with a rapid learning curve [1] and a low incidence of complications [2], its success rate has been reported to be only 75% in pediatric patients [3,4]. Several reasons have been suggested: first, the relationships among the landmarks for caudal block have not been assessed sufficiently in children [5]; second, caudal block is usually performed under anesthesia [6,7] because children do not cooperate well with procedures, making it difficult to confirm a successful block.
Several methods, such as changes in heart rate [8,9], whoosh and swoosh test [10,11], and ultrasonography use, [12,13], have been developed and validated to confirm the success of block or needle placement. Pulse transit time (PTT), which is obtained by calculating the time interval between the R-wave peak on the electrocardiogram (ECG) and the maximum upslope of the corresponding photoplethysmographic waveform, is defined as the time interval the arterial pulse pressure wave travels from the aortic valve to the periphery, and it may be a predictor or indicator for confirming successful peripheral nerve or axial block because of the decrease in arterial resistance after sympathetic nerve block [14,15]. Another noninvasive indicator, heart rate variability (HRV), is the physiological variation in the time interval between heartbeats. Because the alteration in sympathetic tone may influence heart rate, tracing HRV along time interval can also help predict sympathetic blockade [16,17].
In this study, we expected PTT, heart rate, and HRV to show a notable change, such as increasing PTT or decreasing heart rate along time, after caudal block. If significant changes were present, we can conclude that PTT or HRV may act as an indicator of successful caudal block.
MATERIALS AND METHODS
Study population
The study was approved by Institutional Review Board (H- 1305-0450488), Ministry of Drug and Food Safety (20130131631) and registered at http://cris.nih.go.kr. After obtaining written informed consent from the parents or legal guardians, pediatric patients aged 12-48 months who were scheduled to undergo elective urological surgeries, such as penoplasty, orchiopexy, circumcision, and hypospadias repair under general anesthesia were enrolled. Exclusion criteria were the history or presence of disorders of the central or peripheral nervous system, drug allergic reaction to local anesthetics, active sepsis or local skin infection at the injection site, coagulopathy, sacral anomalies, or other complications inappropriate for the study.
Study protocol
On the day of surgery, the patients arrived in the operating theater after appropriate fasting and without premedication. They were monitored (Solar 8000, GE Medical, USA) using lead II of a three-lead ECG, noninvasive blood pressure at 1-min and 2.5-min intervals during and after induction, respectively, peripheral pulse oximetry (SpO2) on the left big toe, and end-tidal carbon dioxide (ETCO2). Anesthesia was inducted with 5-6 mg/kg sodium thiopental, and 8 vol% sevoflurane in oxygen was inhaled after loss of consciousness. A neuromuscular blocking agent (0.6 mg/kg rocuronium) was administered to facilitate tracheal intubation. The patients were anesthetized with conventional anesthesia with 2.5-3 vol% sevoflurane in 35% oxygen after intubation, and sevoflurane concentration was decreased to 1 MAC at the end of surgery and fixed at the same concentration while the caudal block procedure was performed. The patient’s body temperature was actively controlled with a warming blanket and air-forced warmer. Five minutes after the caudal block, the patients were awoken from anesthesia by turning off the sevoflurane and recovered from the neuromuscular blockade with 0.25 mg/kg atropine and 0.02 mg/kg neostigmine. The patients were extubated when they were fully awake. The patients were transferred to the post-anesthetic care unit (PACU) and stayed for at least 30 min for stabilization. We also checked the postoperative pain scale (FLACC scale) [18] and emergence delirium scale (PAED scale) [19] in the PACU.
Caudal block procedure
The patients were placed in the right lateral bent knees position after the end of surgery, and the attending anesthesiologist palpated and drew the anatomical landmarks on the body. Heart rate, ECG, blood pressure at 1 min intervals, and SpO2 were monitored continuously. Subsequently, the sacral hiatus was identified by ultrasonography (Logiq e, GE Healthcare, USA) with a 12-MHz linear probe before puncturing the skin. Next, a 25-gauge B bevel needle was inserted until a marked decrease in resistance was noted, followed by a 1 ml/kg 0.25% ropivacaine injection containing 1 : 200,000 epinephrine. A test dose was injected first, and expansion of the epidural space was noted. During drug injection, the area over the lower lumbar spine corresponding to the needle tip was auscultated for an audible “swoosh” to confirm successful needle positioning. The injectate was also visualized within the caudal canal by using ultrasonography; the block was considered successful with identification of the “swoosh” sound. We maintained the patient’s position at the right lateral bent knees for 5 min after the procedure, which is identical to the position at the beginning of the procedure.
Data analysis
Heart rate, ECG, blood pressure at 1 min interval, and photoplethysmograph (PPG) data from the patient monitor were transferred to a personal computer using an analog-to-digital converter (DA 149, DATAQ Instruments, USA) at a 1,000-Hz frequency.
Pulse transit time analysis
The PTT was measured as the time interval between the R-wave peak on the ECG and the maximum upslope of the corresponding PPG waveform, which was derived automatically from its first derivative using the CALC package of the Advanced CODAS analysis software (ver. 3.25; WinDaq, DATAQ Instruments, USA) [20]. We filtered the data using the following algorithm to reduce PPG signal artifacts: each pulse wave was compared to the mean pulse wave of 10 subsequent pulse waves ± 1 SD. If 25% or more of the current pulse wave was outside this window, the pulse wave was filtered out. The PTT was calculated for the remaining pulse waves.
Heart rate variability analysis
ECG data were reviewed by visual inspection. Segments with signal loss or significant noise, or atrial or ventricular extrasystole(s), were discarded. R-R intervals were measured and tested for the presence of outliers (heart rate > 200 beats/min), and any outliers found were removed. The HRV was calculated automatically with LabChart (ver. 7; AD Instruments, USA) at 1-min intervals. Time domain indices that utilize NN interval (normal-to-normal interval, equivalent to R-R interval), such as standard deviation of normal-to-normal intervals (SDNN) (measures total variability that arises from both periodic and random sources) and root mean square of successive differences (RMSSD) (independent of long-term trends and predominantly reflects vagal tone), were obtained. The frequency domain method is a kind of HRV analysis that assigns bands of frequency (ultralow, very low, low, and high) and then count the number of NN intervals that match each band. This method yields information regarding the amount of the overall variance in heart rate resulting from periodic oscillations of heart rate at various frequencies. High frequency (HF: 0.15-0.4 Hz) is mediated parasympathetically and primarily represents respiratory variation. Low frequency (LF: 0.04-0.15 Hz) is modulated by both the sympathetic and parasympathetic nervous systems and is strongly affected by the oscillatory rhythm of the baroreceptor system. Very low frequency (VLF: 0.0033-0.04 Hz) and ultralow frequency power (ULF: 1.15 × 10⁻⁵-0.0033 Hz) may represent the influence of thermoregulatory, peripheral vasomotor, or renin-angiotensin systems [21]. The LF/HF ratio has been used as an index of the sympathetic/parasympathetic balance. Cardiac autonomic function was assessed by frequency-domain HRV analysis in the range of 0-1 Hz on normal R-R intervals. A fast Fourier transformation was used to perform power spectral density analysis based on the Welch method.
As a non-linear method, approximate entropy (ApEn) of the R-R interval was calculated and taken into analysis. ApEn is a derivative that describes the regularity of pattern in data sets. It is defined as the logarithm of likelihood wherein similar short segments of data, two consecutive data for example, remain similar when the next datum (the third in this case) is added. This can be regarded as a measure of predictability. A higher ApEn was associated with a lower predictability [22]. The ApEn of the R-R interval in the ECG was calculated using MATLAB (ver. 2016b, MathWorks Inc., USA) at 1-min intervals from 1 min before to 5 min after the block. The MATLAB code for calculating ApEn originated from the following web site: https://kr.mathworks.com/matlabcentral/fileexchange/26546-approximate-entropy. The mean heart rate for each 1-min period was also calculated and taken into analysis.
Primary and secondary outcomes
Changes in PTT, blood pressure, heart rate, and HRV parameters from the baseline in the supine position to 5 min after the caudal block were the primary outcome of this study. The secondary outcomes were ApEn of the R-R interval, postoperative pain, and emergence agitation scales. All of the mentioned data were obtained for 1 min before the block as baseline, and for 5 min after the block at 1-min intervals. The FLACC score was measured upon arrival, 15 min, and 30 min after arrival at the PACU. The PAED score was measured upon arrival and at discharge from the PACU.
Statistical analysis
Values are shown as the mean ± SD (normally distributed data). Analyses of PTT, HRV parameters, ApEn of the R-R interval, and FLACC scores were performed using one-way repeated measures analysis of variance (RMANOVA). Either RMANOVA or Friedmann RMANOVA on ranks was selected after the normality test. Sphericity assumption was evaluated via the Mauchly sphericity test. The Greenhouse-Geisser correction was used when sphericity was not violated. The Wilk lambda, a multivariate test statistics, was used to obtain the F ratio when sphericity was violated. The PAED scores upon arrival and at discharge from the PACU for each individual were compared using paired t-test. Statistical analyses were performed with the SPSS software (ver. 22.0; IBM Corp., USA). P values < 0.05 were considered statistically significant.
Sample size calculation
We planned a one-way RMANOVA for a single group as a method for PTT and HRV analyses. Each measurement was analyzed six times (baseline, each 1-min period after caudal block for 5 min). Because no previous similar study was published, the effect size f was set at medium (0.25). At the level of α = 0.05, power = 0.8, the required total sample size was 19. The expected dropout rate, including block failure, was 30%, and the number of candidates was set to 27. The calculations were performed via G*Power (ver. 3.1.9.2; Universistät Kiel, Germany).
RESULTS
In summary, 27 patients completed the study, and 23 datasets were collected; data for four patients were removed because of loss of data. Demographic data are shown in Table 1. All patients were male.
Table 1
Demographic Data (n = 23)
| Age (yr) | 2.24 ± 0.93 |
| Height (cm) | 92.20 ± 9.66 |
| Weight (kg) | 14.49 ± 4.15 |
| Total operation time (min) | 69.35 ± 25.46 |
| Total anesthesia time (min) | 94.78 ± 27.07 |
| PACU stay time (min) | 38.43 ± 5.26 |
No significant change was found in PTT over time (P = 0.562) (Table 2).
Table 2
PTT Changes
| Baseline | 1 min | 2 min | 3 min | 4 min | 5 min | Ptime | |
|---|---|---|---|---|---|---|---|
| PTT (ms) | 233.57 ± 52.61 | 232.89 ± 50.41 | 232.96 ± 49.45 | 233.49 ± 49.17 | 231.62 ± 49.14 | 229.94 ± 47.90 | 0.562 |
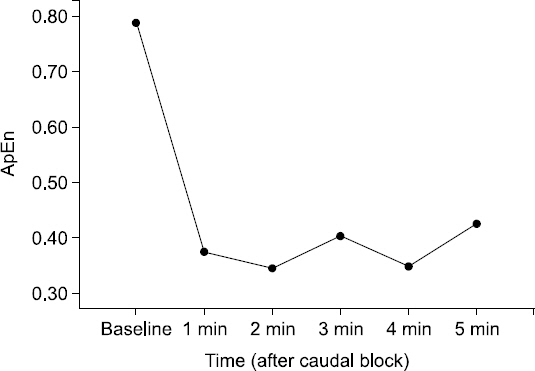
In HRV analysis, the mean heart rate for each 1-min period decreased over time (P = 0.001). There was a significant change in SDNN (P = 0.047), which decreased over time until 3 min after the block, and rebounded for the last 2-min period. Change in RMSSD resembled that of SDNN, but was not statistically significant (P = 0.222). In frequency domain measures, VLF, LF, HF, and LF/HF also showed decreasing pattern followed by upstroke 3 min after caudal block, although statistically insignificant (P = 0.062, 0.213, 0.420, 0.271, respectively). ApEn of the R-R interval showed decrease after caudal block along time (P = 0.033) (Table 3). Visually, a dramatic decrease of ApEn was observed immediately after the block followed by a little change afterward (Fig. 1).
Table 3
Heart Rate Variability Parameters
| Baseline | 1 min | 2 min | 3 min | 4 min | 5 min | Ptime | |
|---|---|---|---|---|---|---|---|
| Mean HR (beats/min) | 124.83 ± 14.53 | 120.08 ± 12.26 | 118.49 ± 12.06 | 116.37 ± 12.10 | 113.53 ± 12.81 | 110.94 ± 13.42 | 0.001* |
| SDNN | 29.66 ± 43.88 | 24.82 ± 27.86 | 16.31 ± 26.24 | 10.49 ± 14.06 | 20.93 ± 23.07 | 36.83 ± 36.63 | 0.047* |
| RMSSD | 21.47 ± 36.29 | 24.92 ± 30.83 | 14.39 ± 23.93 | 10.27 ± 16.80 | 17.44 ± 24.55 | 29.44 ± 36.91 | 0.303 |
| VLF (ms2) | 1,069.74 ± 2,464.02 | 181.11 ± 332.19 | 258.02 ± 1,029.12 | 22.67 ± 38.54 | 104.99 ± 152.64 | 881.11 ± 2,313.45 | 0.062 |
| LF (ms2) | 710.74 ± 1,625.67 | 417.28 ± 817.54 | 174.03 ± 658.50 | 58.27 ± 190.38 | 294.48 ± 906.44 | 569.30 ± 1,271.37 | 0.213 |
| HF (ms2) | 445.82 ± 1,204.53 | 448.40 ± 919.19 | 206.37 ± 648.23 | 120.64 ± 380.05 | 359.83 ± 996.51 | 1,009.80 ± 2,633.49 | 0.420 |
| LF/HF | 4.75 ± 10.05 | 0.84 ± 0.89 | 2.08 ± 6.41 | 1.03 ± 1.53 | 0.93 ± 1.07 | 3.01 ± 7.16 | 0.271 |
| ApEn | 0.79 ± 0.46 | 0.37 ± 0.32 | 0.35 ± 0.28 | 0.40 ± 0.32 | 0.35 ± 0.25 | 0.43 ± 0.26 | 0.033* |
Values are presented as mean ± SD. Mean HR: mean heart rate of each 1-min period, SDNN: standard deviation of all normal-to-normal intervals, RMSSD: square root of the mean of the sum of the squares of differences between adjacent normal-to-normal intervals. VLF: power in very low-frequency range (∼0.04 Hz), LF: power in low-frequency range (0.04-0.15 Hz), HF: power in high-frequency range (0.15-0.4 Hz), LF/HF: ratio of LF (ms2)/HF (ms2), ApEn: approximate entropy of the R-R interval. Baseline: before administration of local anesthetics, 1-5 min: after administration of local anesthetics.
Fig. 1
Change in approximate entropy (ApEn) of the R-R interval on the electrocardiogram from baseline to 5 min after the caudal block. Statistically significant change was present (P = 0.033).
In traditional means of measurement, the heart rate at each 1-min point decreased over time (P = 0.001). Systolic blood pressure, diastolic blood pressure, and mean blood pressure showed a slightly decreasing pattern until 2 min after the block, followed by an increasing pattern for the last 3 min (P = 0.092, 0.380, 0.046, respectively) (Table 4).
Table 4
Heart Rate and Blood Pressure Changes
| Baseline | 1 min | 2 min | 3 min | 4 min | 5 min | Ptime | |
|---|---|---|---|---|---|---|---|
| Heart rate (beats/min) | 119.67 ± 12.55 | 117.52 ± 12.52 | 116.48 ± 12.80 | 114.24 ± 12.96 | 110.62 ± 13.24 | 108.52 ± 14.88 | 0.001* |
| SBP (mmHg) | 81.62 ± 14.57 | 82.00 ± 9.67 | 81.67 ± 10.62 | 81.67 ± 11.60 | 83.38 ± 11.65 | 85.38 ± 13.34 | 0.092 |
| MBP (mmHg) | 42.38 ± 8.35 | 42.62 ± 8.17 | 41.90 ± 9.97 | 43.48 ± 9.87 | 44.33 ± 11.59 | 44.57 ± 11.16 | 0.046* |
| DBP (mmHg) | 57.43 ± 11.53 | 57.43 ± 10.32 | 56.43 ± 12.29 | 57.24 ± 12.50 | 58.43 ± 14.90 | 61.71 ± 15.98 | 0.380 |
The FLACC and PAED scores decreased over time, although PAED change was not statistically significant (P = 0.007, 0.054, respectively) (Table 5).
Table 5
Pain Scale and Emergence Agitation Scale
| PACU arrival | 15 min | 30 min | Ptime | |
|---|---|---|---|---|
| FLACC | 2.43 ± 2.59 | 1.57 ± 1.70 | 0.48 ± 1.31 | 0.007* |
|
|
||||
| PACU arrival | PACU discharge | P value | ||
|
|
||||
| PAED | 5.48 ± 5.74 | 2.96 ± 3.21 | 0.054 | |
DISCUSSION
PTT is strongly affected by arterial muscle tone, and changes in PTT indicate changes in arterial muscle tone. The arterial muscle tone could decrease with sympathetic nerve block, and this would indicate the result of epidural anesthesia, such as caudal block. Local anesthetics injected into the epidural space prevent conduction by the spinal nerves. This decreases the activity of the sympathetic nervous system and relaxes the arteries, as indicated by the increase in PTT. The same phenomenon occurs in caudal block. This was demonstrated in a previous study [15]. In that study, PTT was measured in the finger and toe, and the difference in the time delay after the block between the toe and finger was found to reflect the hemodynamic changes induced by the block with higher reliability than the routine methods based on skin temperature and arterial blood pressure. PTT increased after epidural block, and this increase was proportional to the anesthetic dose. In addition, the degree of increase was inversely proportional to age. Based on these results, we expected PTT to increase after caudal block. However, PTT did not show a significant change over time after caudal block, leading to the conclusion that PTT may not be a reliable indicator of successful caudal block in short-time interval.
HRV can reflect the status of the cardiac autonomic nervous system in real time, and the heart rate itself is surely influenced by sympathetic tone. The mean heart rate for 1-min interval decreased over time, which was statistically significant. Furthermore, a decrease was observed in ApEn of the R-R interval after the caudal block. This may imply that the decrease of sympathetic tone and increased predictability of heart rate, that is, less variability. We found that a previous study demonstrated that changes in the heart rate after a caudal block when anesthetized with sevoflurane were not a reliable indicator [9]. The authors of the previous study suggested that this response indicated an inter-individual beat-to-beat variability; hence, the results of our study may suggest an alternative method, which is ApEn of the R-R interval, for analyzing the heart rate after the caudal block. In addition, our results showed a significant change in the heart rate after caudal block.
Although the frequency domain measurements of HRV did not show a statistically significant change, a common change pattern was observed among them. VLF can reflect peripheral vascular tone. Decreased VLF after caudal block implies decreased peripheral vascular tone, which is relevant to sympathetic blockade. LF is under the influence of the sympathetic and parasympathetic nervous systems, and HF is affected primarily by the parasympathetic nervous system [21]. LF/HF was considered to show balance of the cardiac sympatho-vagal nervous activity, although it is still debated [23]. From this background, we can infer that the sympathetic tone may have decreased for 3 min after the caudal block, and recovered after that.
The time domain measurements of HRV, such as SDNN and RMSSD, resembled the results of frequency domain measurements. A decrease in SDNN is equivalent to a decrease in variability of the R-R interval because we gained a similar result with the ApEn calculation. Therefore, we can say that the heart rate variability decreased in less than 3 min after caudal block, which was followed by recovery afterward.
This study has several limitations. First, the period of observation might have been insufficient to expect a significant change in PTT and HRV considering the onset time of ropivacaine (generally 10 min after epidural injection). ApEn and frequency-domain measurements show that a decrease in the sympathetic tone still seems to precede an actual analgesic effect, although statistically insignificant. We should consider this when designing further studies. Second, we could not absolutely confirm successful caudal block in each patient. Because no gold standard method exists for assessing successful block in children, we sought to confirm success with several methods simultaneously during the procedure. With these methods, we regarded all of the cases as successful caudal block, but it is still questionable. Finally, all of the enrolled children were boys. Considering the effects of age and sex on HRV [24], the population in this study could have biased the results. Despite these limitations, the results could be valuable, although preliminary.
In conclusion, heart rate analysis along with HRV parameters may be useful as a means for confirming successful caudal block, rather than PTT.


