


INTRODUCTION
Intraoperative neurophysiologic monitoring (INM) during neurosurgery is currently performed in most institutions to prevent neuronal damage. Motor-evoked potentials (MEPs) are a representative INM technique [1,2].
Some neuromuscular blockade (NMB) drugs significantly influence MEP monitoring during anesthesia [2,3]. However, if no NMB drug is used, higher levels of anesthetics are required to avoid the risk of spontaneous movement during surgery. Maintaining deep anesthesia can cause hemodynamic instability which is poorly tolerated by some patients, necessitating use of vasopressors [4,5]. One anesthetic technique for ensuring successful MEP monitoring with absolute immobility is to maintain partial NMB status during monitoring. Continuous intravenous NMB drug infusion is occasionally used to achieve partial NMB status [1,2,6,7]; in that situation, maintaining strictly steady NMB status is essential to ensure stable MEP monitoring.
Vecuronium and cisatracurium are two widely used NMB drugs. Vecuronium is associated with hemodynamic stability and safety, but it is primarily eliminated via hepatic metabolism, biliary excretion, and renal excretion. It can be associated with prolonged NMB administration, especially in patients with renal disease [8,9]. However, cisatracurium can be used in patients with severe hepatic or renal failure due to its organ-independent elimination [10]. Neuromuscular function recovery after infusions are discontinued in intensive care unit was significantly faster with cisatracurium than vecuronium even in patients without renal insufficiency [8,9].
We hypothesized that cisatracurium might exhibit less within-patient variability in MEP amplitude in all four limbs during the intraoperative MEP monitoring periods. Therefore, we attempted to compare the effects of vecuronium and cisatracurium on the efficacy of intraoperative MEP monitoring.
MATERIALS AND METHODS
We performed this study at a tertiary hospital; the hospital ethics committee approved the study (IRB No. 2012-05-090), and we registered at www.clinicaltrials.gov (protocol ID NCT01690364). All patients signed informed consent, and we confirm that all ongoing and related trials for this intervention are registered.
Our inclusion criteria were adult patients aged 20 to 75 years who were undergoing neurosurgery for craniotomy and tumor removal, spinal laminectomy, or cerebral aneurysm clipping with MEP monitoring from August 2012 to March 2013 at our hospital. Ultimately, we enrolled 74 patients were enrolled.
We excluded patients if they had hepatic disease, renal disease, severe cardiopulmonary disorders with hemodynamic instability, neuromuscular disease, or American Society of Anethesiologists physical status class III or higher.
This was a double-blind, randomized control, parallel-group study. We randomly assigned the patients into one of two groups and maintained either continuous intravenous vecuronium (Group V, 37 patients) or cisatracurium (Group C, 37 patients) in 1’╝Ü1 ratio. We used a computer-generated randomizer (www.randomizer.org) to randomly assign the subject numbers; only the attending anesthesiologist was informed about the study group before administering the anesthesia. The syringe pump was prepared and sealed before each surgery, and thus, the attending surgeons and neurophysiologists could not determine what the drug was.
Patients did not receive premedication. They were monitored intraoperatively for electrocardiography, pulse oximetry, esophageal temperature, noninvasive blood pressure, and arterial blood pressure.
The anesthesiologist administered intravenous propofol (3-6 μg/ml) and remifentanil (1.5-4 ng/ml) with a target controlled infusion pump (Orchestra®, Fresenius vial, France) to induce and maintain anesthesia and used rocuronium (0.6 mg/kg) to facilitate intubation. Baseline twitch response was established with a neuromuscular transmission module (M-NMT Module, Datex-Ohmeda Inc., Finland) at the adductor pollicis before the anesthesiologist injected the rocuronium; this module displays the train-of-four (TOF) values numerically. We considered maximal T1 response before rocuronium administration to be the control response, Tc, and the anesthesiologist began the continuous intravenous NMB infusions in each group after successfully setting the baseline MEP amplitude; the target partial NMB level was T1/Tc 50% in both groups. Initial doses were 0.5 μg/kg/min for vecuronium and 0.7 μg/kg/min for cisatracurium; we determined these initial doses based on our pilot study, which revealed that these were the mean doses for maintaining T1/Tc 50% for the two drugs. The drug infusion rate was adjusted every 15 minutes to maintain T1/Tc 50% from the start of infusion to the end of MEP monitoring. When the T1/Tc was over 50%, the dose was increased by 0.1 μg/kg/min, and in the opposite case, it was decreased by the same amount.
MEP amplitude was measured by a neurophysiologist who was blinded to the study group. MEP was recorded by paired subdermal needle electrodes inserted into all four limb muscles (the abductor pollicis brevis, adductor digitorum quint, tibialis anterior, and abductor hallucis). MEPs were triggered by electrical stimulation of the scalp with an XLTEK Protektor IOM machine (Optima Medical Ltd., United Kingdom). It delivered electrical stimulus pulse trains (pulse width = 50 ╬╝s, n = 5, interpulse interval = 2 ms, 500 Hz) between the two electrodes placed over the motor cortex region at C3 and C4 (International 10-20 System). The optimal baseline amplitude was obtained by adjusting the MEP stimulus intensity in intervals of 50 V from a starting value of 400 V, and lower stimulus intensity was chosen if adequate amplitude had been obtained. Stimulus intensity and baseline stimulation parameters were determined at the beginning of MEP monitoring and were kept constant throughout.
The neurophysiologist set baseline MEP amplitude and latency between induction and incision and stopped monitoring it after the main operation had ended and the closure suture had begun. MEP amplitude and latency were recorded every 15 minutes throughout the monitoring (Fig. 1). To estimate within- patient variability, we compared the mean MEP amplitudes and the coefficients of variation (CVs, %) of all measured MEP amplitudes in four limbs between the groups. We calculated the CVs as standard deviation divided by mean based on previous studies that had used the CV as a measurement of within-patient variability [11,12].
In addition, we evaluated the frequency of NMB drug dose changes, durations of continuous infusions, anesthesia drug doses administered, end-tidal CO2 (mmHg), core temperature, and the incidence of patientsŌĆÖ spontaneous movement or respiration. When spontaneous movement or respiration occurred, the first response was to increase the doses of propofol and remifentanil to 0.5-2 ng/ml. If this failed to attenuate movement or respiration, a bolus dose of the relevant drug was allowed (0.5-2 mg for both vecuronium and cisatracurium).
Fig.┬Ā1
An example of intraoperative motor evoked potential (MEP). The thin line shows baseline MEP, and the thick line shows the present MEP after electrical stimulus pulse trains. APB: abductor pollicis brevis, ADQ: adductor digitorum quint, TA: tibialis anterior, AH: abductor hallucis.

Statistical analysis
We determined the sample size for this study following a pilot study. Our primary outcome was the CVs of all measured MEP amplitudes in all four limbs, measured every 15 minutes during intraoperative monitoring; the secondary outcome was the frequency of drug dose changes. Based on the pilot study, we expected a mean of 65% and SD of 30 for the CV of MEP amplitude for vecuronium injection, and we hypothesized that there would be more than a 20% difference in the CVs of MEP amplitude between Groups V and C. A power analysis (╬▒ = 0.05, ╬▓ = 0.20) showed that 36 patients would be required for each group, so considering dropouts, we enrolled 74 patients.
We analyzed all data using SPSS software (SPSS 20.0, USA). Specifically, we used the chi-square test or FisherŌĆÖs exact test for the categorical variables, and for the continuous variables, we used a two-sample t-test or Mann- Whitney U test depending on the normality of the variables. We also used the Shapiro-Wilk test to evaluate the normality of all continuous variables, and we considered P values of <0.05 statistically significant.
Specifically, we used the chi-square test to analyze the incidence of respiration and the two-sample t-test for mean ETCO2, mean temperature, mean potassium, MEP amplitude, and CV.
RESULTS
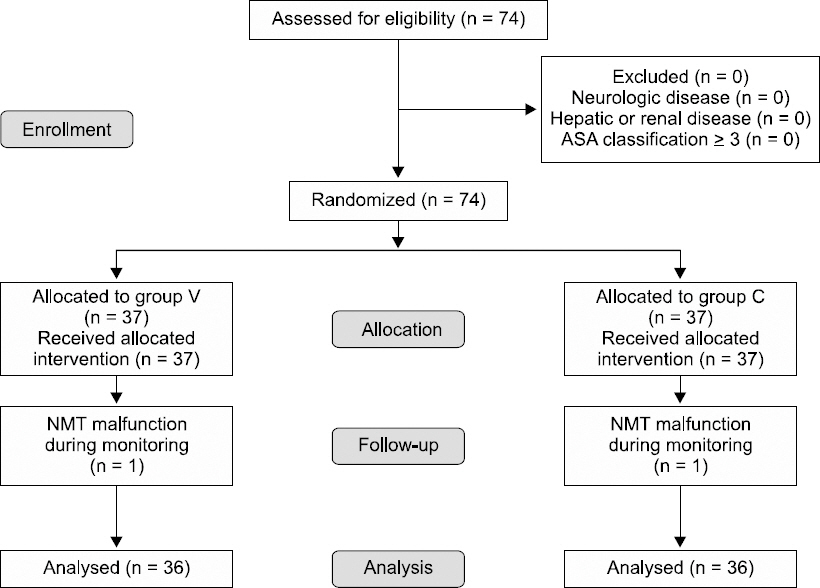
As we noted, we enrolled a total of 74 patients in the study based on power analysis. We dropped two patients, one each from Groups V and C, because the NMT module malfunctioned during MEP monitoring (Fig. 2); we maintained TOF counts of two or three when this happened.
Fig.┬Ā2
The flow diagram of the study according to the CONSORT 2010. Group V: maintaining continuous vecuronium, Group C: maintaining continuous cisatracurium.
There was no spontaneous movement during surgery in either group, and the demographic and perioperative data did not differ between the groups either (Table 1). Values are presented as mean (SD), medians (interquartile), or numbers.
Table┬Ā1
Comparison of Demographics and Perioperative Clinical Variables
Mean propofol and remifentanil doses did not differ between the two groups. The mean continuous infusion rate was 0.50 ╬╝g/kg/min in Group V and 0.69 ╬╝g/kg/min in Group C. Additionally, the frequency of changing the doses was significantly lower in Group V than in Group C: 4 (interquartile range, 3-5) vs. 6 (interquartile range, 5-8) (P = 0.021). However, the infusion durations also did not differ significantly between groups (P = 0.513): 236.1 (121.8) min in Group V vs. 214.4 (98.9) min in Group C. Incidence of self-respiration also did not differ significantly (P = 0.101; Table 2): 8 cases in Group V vs. 3 in Group C; however, respiration disappeared when the anesthesiologist increased the propofol and remifentanil doses in all cases, and no bolus injections were required in both groups.
Table┬Ā2
Comparison of Anesthesia-related Factors
MEP monitoring profiles are shown in Table 3. Neither mean stimulus intensities, mean MEP amplitudes and their CVs, nor the latency values for all four limbs differed significantly between the groups, and MEP monitoring was successful in both groups.
Table┬Ā3
Comparison of MEP Monitoring Profiles
Surgery types also did not differ between two groups (Table 1).ŌĆā
DISCUSSION
In this study, we compared the effects of vecuronium and cisatracurium on MEP amplitude and variability, and the results showed no significant differences between the two drugs on those variables. However, cisatracurium did require more frequent changes in the infusion rates to maintain T1/Tc 50%.
Reports that compared the recovery profiles of vecuronium and cisatracurium suggested that neuromuscular function was recovered significantly more quickly following continuous infusion of cisatracurium than of vecuronium regardless of age [8,9,13,14]. In addition, cisatracurium showed less variability in the spontaneous recovery profiles following the final administration of either drug, especially in elderly patients. This evidence suggested that the organ-independent elimination of cisatracurium via Hofmann degradation might have been responsible [14]. In the present study, vecuronium and cisatracurium induced comparable MEP amplitudes and variability. However, the relatively short monitoring time and broad patient age range may have disguises any pharmacokinetic and pharmacodynamic differences between the drugs.
The slower onset of cisatracurium may account for the more frequent changes to the cisatracurium infusion dose (Table 3). It is probable that cisatracurium took longer to attain a steady blood concentration of T1/Tc 50%.
The initial doses of each drug (0.5 ╬╝g/kg/min for vecuronium and 0.7 ╬╝g/kg/min for cisatracurium) based on our pilot study appear to be reasonable in light of our current study results (Table 2). It is reported that the ED95 is approximately 0.05 mg/kg for both vecuronium and cisatracurium [9,14-16], although the recommended initial dose for intubation is 0.1 mg/kg (2 ├Ś ED95) for vecuronium, whereas that for cisatracurium is 0.15 mg/kg (3 ├Ś ED95) owing to its slow onset [10,17]. We thought that this discrepancy in the recommended intubation doses would influence the time to equilibrium and our interpretations of the efficacy results for the two drugs; therefore, we applied the same protocol (rocuronium 0.6 mg/kg) for intubation in both groups. Our findings showed that a larger dose of cisatracurium was needed to maintain the same NMB status, and this difference could not be explained solely by slow onset time because the mean operation time was more than four hours.
Some controversy exists about the adequate degree of muscle relaxation required for MEP monitoring. Sloan and Heyer [2] suggested that successful monitoring has been accomplished at T1 between 5% and 50% of baseline. Usually, the variability in MEP amplitude decreases with lower NMB levels [12], and we presumed that T1/Tc 50% would allow for successful MEP monitoring and detection of any inter-group variability differences; in fact, with the NMB levels set at T1/Tc 50%, MEP monitoring was successful in this study.
There were some cases of self-respiration during surgery that required bolus NMB infusions. Most of them occurred before the start of the incision, possibly because of shallow anesthetic level or unsteady NMB status early in the continuous infusion.
Contrary to our hypothesis, there were no significant differences between the two study groups on the means and CVs of MEP amplitude. With the same TOF level, it appears that the NMB drug has little effect on the size and variability of MEP amplitude. That is, vecuronium can be used interchangeably with cisatracurium during MEP monitoring.
The present study has several limitations. First, we did not monitor bispectral index or entropy to evaluate depth of anesthesia because the sensor attachment site was in close proximity to the operating site or in the prone position. However, because the mean propofol-remifentanil TCI dose was not different between the groups, we expected similar depths. Second, there could be controversy about the reliability of the NMT module we used in this study. We used the M-NMT module for the quantitative evaluation of NMB status. This is a kind of kinemyography, and it is highly practical in clinical settings. Multiple studies have reported it to be a reliable device [18,19]. Special attention was paid to patient hand position in our study, and the M-NMT module performed well. Additionally, there are many other NMB drugs available for anesthesia; because we only compared two, it is possible that comparison with other drugs might have shown different outcomes. Third, we calculated the sample size for this study to be 72 patients, but in the study protocol, we assumed a dropout rate of 10%, which results in a total sample size of 80 patients. We stopped patient recruitment after 72 successful cases because the dropout rates were lower than we expected, but we do think that this could have caused bias in the study.
In conclusion, both vecuronium and cisatracurium provided similar MEP monitoring quality, but more effort was needed with cisatracurium to attain a steady NMB state.


