Verification of the performance of the Bispectral Index as a hypnotic depth indicator during dexmedetomidine sedation
Article information

Abstract
Background
Differences in the effects of propofol and dexmedetomidine sedation on electroencephalogram patterns have been reported previously. However, the reliability of the Bispectral Index (BIS) value for assessing the sedation caused by dexmedetomidine remains debatable. The purpose of this study is to evaluate the correlation between the BIS value and the Modified Observer’s Assessment of Alertness/Sedation (MOAA/S) scale in patients sedated with dexmedetomidine.
Methods
Forty-two patients aged 20–80 years, who were scheduled for surgery under spinal anesthesia were enrolled. Spinal anesthesia was performed using 0.5% bupivacaine, which was followed by dexmedetomidine infusion (loading dose, 0.5–1 μg/kg for 10 min; maintenance dose, 0.3–0.6 μg/kg/h). The MOAA/S score was used to evaluate the level of sedation.
Results
A total of 215082 MOAA/S scores and BIS data pairs were analyzed. The baseline variability of the BIS value was 7.024%, and BIS value decreased, as the MOAA/S scored decreased. The correlation coefficient and prediction probability between the two measurements were 0.566 (P < 0.0001) and 0.636, respectively. The mean ± standard deviation values of the BIS were 87.22 ± 7.06, 75.85 ± 9.81, and 68.29 ± 12.65 when the MOAA/S scores were 5, 3, and 1, respectively. Furthermore, the cut-off BIS values in the receiver operating characteristic analysis at MOAA/S scores of 5, 3, and 1 were 82, 79, and 73, respectively.
Conclusions
The BIS values were significantly correlated with the MOAA/S scores. Thus, the BIS along with the clinical sedation scale might prove useful in assessing the hypnotic depth of a patient during sedation with dexmedetomidine.
INTRODUCTION
Patients undergoing surgery under spinal anesthesia must be sedated to reduce anxiety and increase treatment satisfaction. Dexmedetomidine, a highly selective α-2 adrenoceptor agonist, is a novel sedative that is widely used as an adjuvant during spinal anesthesia. It induces a unique sedative response due to its analgesic, anxiolytic, sympatholytic, and opioid-sparing properties, which results in an easy transition from sleep to wakefulness, thus allowing the patient to be cooperative and communicative when stimulated. Moreover, it rarely causes respiratory depression, and the sympatholytic effect of the drug enables the hemodynamics to remain stable during the perioperative period [1,2].
It is not easy to accurately predict the patient’s response to a sedative. The pharmacokinetics and pharmacodynamics of the drugs are affected by several factors, such as race, age, and the presence of comorbidities. Therefore, an identical dosage of the same drug could induce different levels of sedation among patients. Elderly patients are more sensitive to sedatives and present with greater variations in response to the drug. Several studies have shown that the level of sedation during surgery can affect the incidence of delirium, cognitive impairment, and mortality after surgery [3–6]. Furthermore, inadequate deep sedation can increase the time it takes to recover from the sedation and can disrupt the planned schedule of the surgery. Therefore, it is very important to maintain an adequate level of sedation using reliable monitoring devices and by observing the clinical signs.
The Bispectral Index (BIS) is a noninvasive monitoring measure used to assess the depth of sedation via an algorithmic analysis of the electroencephalogram (EEG). Its use in general anesthesia is considered essential to minimize the possibility of intraoperative awareness. Additionally, the BIS have been proven reliable for assessing the hypnotic effects of various anesthetic drugs and sedatives such as propofol, inhaled anesthetics, and midazolam [6–9]. However, the reliability of the BIS value in assessing the sedation effects of dexmedetomidine remains questionable. Xi et al. [10] reported differences in the EEG dynamics between dexmedetomidine and propofol at the same level of sedation and suggested that these differences might account for the alterations in the BIS value.
The aim of the present study is to evaluate the correlation between the BIS and the commonly used Modified Observer’s Assessment of Alertness/Sedation (MOAA/S) scale in patients sedated with dexmedetomidine. Furthermore, we intended to verify the clinical validity, reliability, and applicability of BIS as an objective assessment tool for monitoring the depth of sedation.
MATERIALS AND METHODS
Study design
This prospective observational study was approved by the Institutional Review Board at our hospital (BP IRB 2019-01-137), and informed consent was obtained from each patient. Clinical research was conducted by following the ethical principles for medical research involving human subjects in accordance with the Helsinki Declaration 2013. Forty-two patients aged between 20 and 80 years (American Society of Anesthesiologists physical status, class I–III) who were scheduled for elective surgery under spinal anesthesia were enrolled in this study. Patients with a history of cerebral nervous system diseases (such as epilepsy), uncontrolled hypertension or heart disease, chronic kidney disease (stage 4 or higher), and neuropsychiatric disorders; those who had difficulty in communicating; and those taking neuropsychiatric drugs were excluded.
The noninvasive blood pressure, heart rate, ECG, and pulse oximetry readings of the patients were monitored throughout the surgery. Spinal anesthesia was performed based on the site of the procedure using 0.5% bupivacaine (MarcaineⓇ Spinal Heavy; 5 mg/ml, AstraZeneca, Sweden) 8–11 mg. The peak sensory block level was evaluated every 2 min until the block heights of the spinal anesthesia were no longer changed. End-tidal CO2 was monitored, and oxygen (2–3 L/min) was administered using a nasal prong.
Prior to dexmedetomidine administration, a BIS monitor (Bispectral Index™, Covidien, USA) was attached to the patient’s forehead as recommended by the manufacturer, and the baseline BIS values were recorded for 2 min and automatically stored in a computer. The Vital Recorder program was used to collect the patient’s data (vital signs and BIS values) [11]. The drug injection method was determined based on the prescription of dexmedetomidine, and a loading dose (1.0 μg/kg for those < 65 years old and 0.5–0.75 μg/kg for those ≥ 65 years old) was given intravenously for over 10 min, followed by a continuous infusion of a maintenance dose (0.3–0.6 μg/kg/h). One investigator, who was blinded to the study, conducted the assessment of the depth of sedation using the MOAA/S scale. If the MOAA/S score was ≤ 2 during the infusion of the loading dose, the maintenance dose was initiated before the planned loading dose was fully administered. The maintenance dose was adjusted within a range of 0.3–0.6 μg/kg/h to maintain the MOAA/S score at 3–4. In the event of bradycardia (heart rate below 40 beats/min), atropine (0.5 mg) or ephedrine (5 mg) was injected intravenously. The MOAA/S score was recorded every 3–5 min during the loading dose infusion period and every 5–10 min during the maintenance dose infusion period. The infusion of dexmedetomidine was stopped approximately 10 min before the surgery was completed, and the MOAA/S score was evaluated every 2–3 min postoperatively to confirm the recovery from sedation.
Data preparation
The MOAA/S score was manually recorded every 3–6 min, and the BIS score was automatically stored in a computer every second. Consequently, the two data were merged based on the time to create data pairs (MOAA/S score–BIS value data pair) that were used for the analysis (Fig. 1A). If the MOAA/S score was 5 at both 12:10:00 and 12:13:00, the MOAA/S score for 3 min was assigned as 5 (Fig. 1B). Thus, the bias due to the waking up of the patient as a result of the physical stimulus while assessing the MOAA/S score was reduced by including the BIS values before, during, and after checking the MOAA/S scores. BIS values that were not stored properly or those with low signal quality index (SQI) values were excluded from the analysis. Furthermore, if the interval between MOAA/S measurements was longer than 5 min, the BIS values 2.5 min before and after measuring the score were included in the analysis.
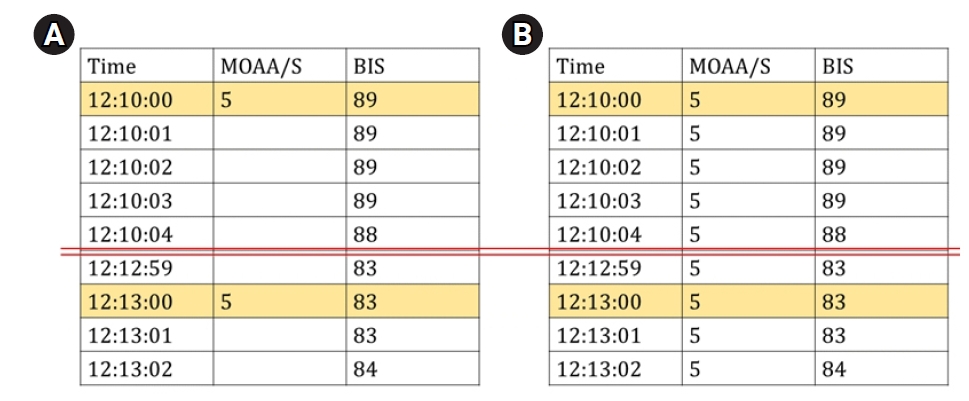
The data preparation process for analysis. (A) Original MOAA/S data, which were manually recorded, and original BIS data, which were automatically recorded by a computer, were merged based on the time recorded. (B) Example of data pairs used in the analysis. MOAA/S: Modified Observer’s Assessment of Alert/Sedation scale, BIS: bispectral index.
Statistical analysis
The primary outcome of the study was to assess the correlation between the MOAA/S score and the BIS value. MedCalc (version 18, MedCalc Software Bvba, Belgium) and GraphPad Prism (version 9, GraphPad Software, USA) were used to perform the statistical analyses. The coefficient of variation (relative standard deviation) of the BIS values obtained 2 min prior to the administration of dexmedetomidine was calculated as the baseline variability. The Spearman’s correlation coefficient and prediction probability (Pk) were determined to evaluate the correlation between the MOAA/S score and the BIS value. The Pk was calculated using the Somers’d statistic and fit4NM 4.6.0 (Eun-Kyung Lee and Gyu-Jeong Noh; http://www.fit4nm.org/download/246; last accessed: 24 June 2014) as follows: Pk = (Somers’d + 1) / 2. A Pk value of 1 indicated a perfect agreement, whereas a Pk value of 0.5 indicated a random relationship. Receiver operating characteristic (ROC) analysis was used to assess the discriminating performance of BIS and to obtain the cut-off BIS value to estimate sedation depth (MOAA/S score). Quantitative data are expressed as mean ± standard deviation (SD). A P value of < 0.05 was considered statistically significant.
RESULTS
This study comprised 42 participants (19 males and 23 females) who were undergoing surgical procedures such as transurethral vapor section for prostate cancer, transurethral bladder surgery for bladder cancer, or knee surgery. A total of 215082 MOAA/S scores and BIS data pairs were analyzed (MOAA/S = 5: 57,219 data pairs; MOAA/S = 4: 65,489 data pairs; MOAA/S = 3: 44,966 data pairs; MOAA/S = 2: 30,934 data pairs; MOAA/S = 1: 6,357 data pairs; and MOAA/S = 0:10,117 data pairs). The data for MOAA/S scores 0 and 1 were low because the dose of dexmedetomidine was adjusted to maintain conscious sedation with a MOAA/S score of ≥ 3. The demographic characteristics of the 42 patients are shown in Table 1. Nineteen patients were < 65 years old and 23 were ≥ 65 years old. The mean operation time was 81.9 ± 39.1 min. Fig. 2 shows the changes in the vital signs during dexmedetomidine infusion. Both blood pressure and heart rate tended to decrease as the drug was intravenously administered. During sedation, the oxygen saturation of the patient was well maintained without any respiratory depression.

Demographic Characteristics of the Patients
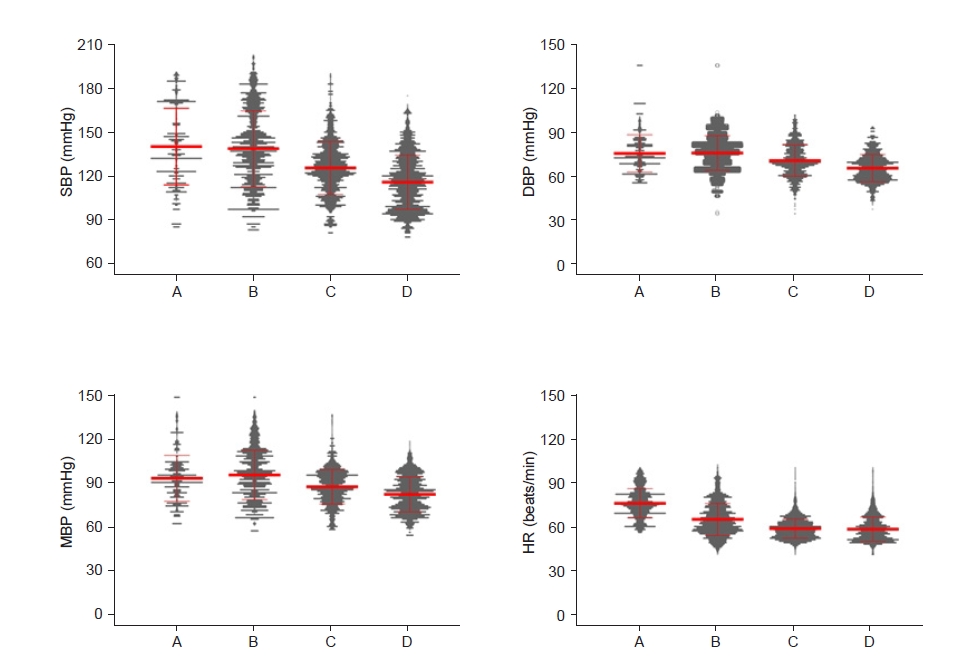
Change in blood pressure (BP) and heart rate (HR) during the study periods, including the dexmedetomidine sedation period. (A) The period before dexmedetomidine administration (baseline). (B) During the loading dose infusion period. (C) During the maintenance dose infusion period. (D) The period after the end of the dexmedetomidine infusion. The red line represents the mean and standard deviation, and the gray point represents the value of each participant. SBP: systolic BP, DBP: diastolic BP, MBP: mean BP.
The baseline variability of the BIS value was 7.024%. The Spearman’s coefficient of rank correlation (95% confidence interval [CI]) was 0.566 (0.563–0.568; P < 0.0001), and the Pk (95% CI) was 0.636 (0.635–0.637). The BIS values significantly decreased with the increase in the level of sedation as evaluated by the MOAA/S score. The mean BIS values when the MOAA/S scores were 5, 3, and 1 were 87.22 ± 7.06, 75.85 ± 9.81, and 68.29 ± 12.65, respectively (Fig. 3).
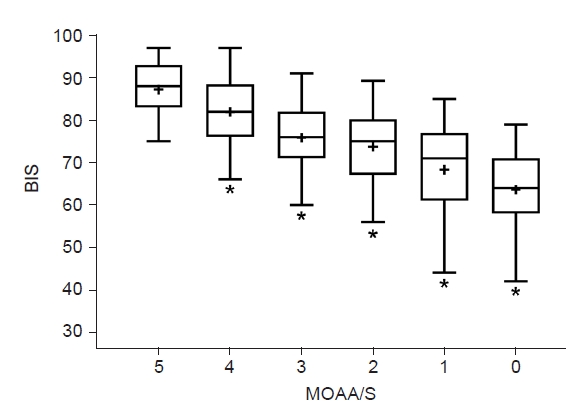
The Bispectral index (BIS) value and Modified Observer’s Assessment of Alert/Sedation (MOAA/S) score. The line in the center of the box represents the median value, the whiskers indicate the 5 to 95 percentiles, and the plus sign (“+”) represents the mean value. *P < 0.05 vs. an MOAA/S score of 5; independent t-test.
Fig. 4 shows the results of the ROC analysis of the relationship between the BIS values and the MOAA/S scores (5, 3, and 1). The cut-off BIS values (Youden index) when the MOAA/S scores were 5, 3, and 1 were 82 (sensitivity, 76.65; specificity, 68.74; area under the curve [AUC], 0.787), 79 (sensitivity, 72.89; specificity, 73.08; AUC, 0.794), and 73 (sensitivity, 72.89; specificity, 79.74; AUC, 0.842), respectively.
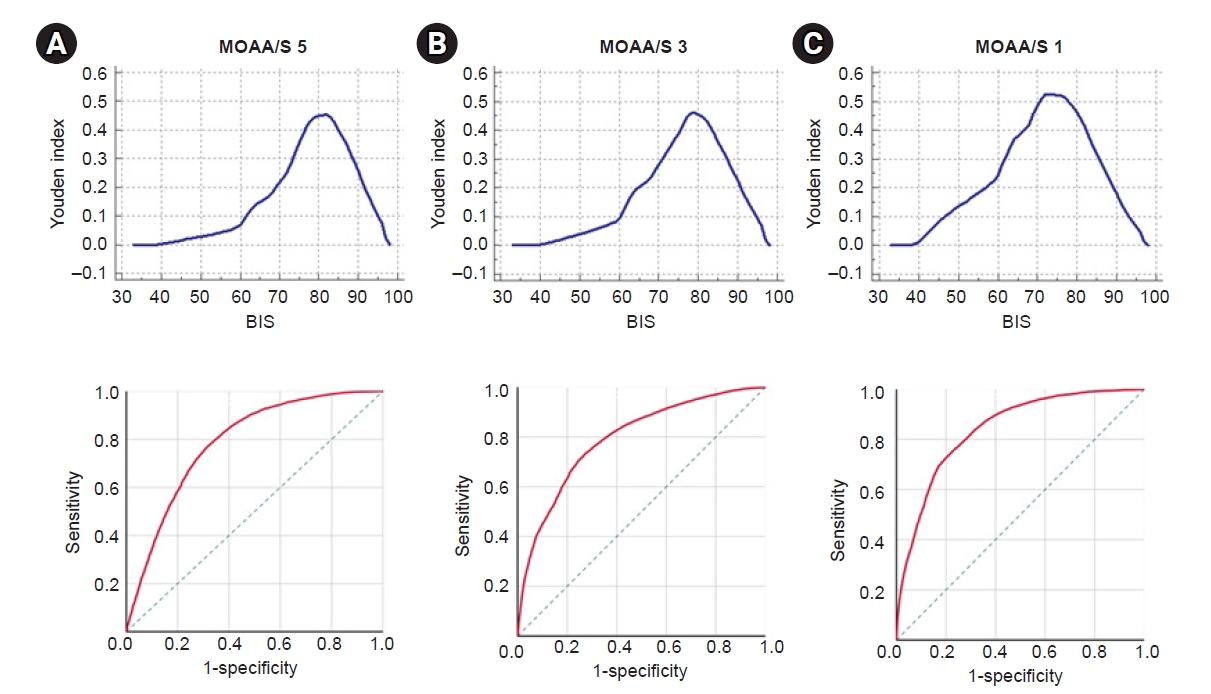
Receiver operating characteristic (ROC) analysis, which was obtained from the association between the MOAA/S score and the BIS value. (A) The cut-off value (up) and ROC curve (down) when the MOAA/S score was 5. (B) The cut-off value (up) and ROC curve (down) when the score was 3. (C) The cut-off value (up) and ROC curve (down) when the MOAA/S score was 1. BIS: Bispectral index, MOAA/S: Modified Observer’s Assessment of Alert/Sedation scale.
After the administration of dexmedetomidine, the average time for the fall in the MOAA/S score to < 5 was 10.40 ± 5.80 min. During the administration of the loading dose, the MOAA/S score dropped to 2 or less, and the planned loading dose was not fully administered; it was altered to the maintenance dose in two male patients aged 55 and 67 years. The MOAA/S scores were monitored to avoid them from falling below 2 while adjusting the maintenance dose of dexmedetomidine. However, 30 patients (14 who were < 65 years old and 16 who were ≥ 65 years old) presented with scores that were ≤2. After stopping the dexmedetomidine infusion, the average time for the restoration of consciousness and the MOAA/S score to reach 5 points was 28.29 ± 18.75 min, and the longest time it took to fully recover was 59.63 min. The older the patients are, the longer it took to recover from sedation (regression equation Y = 0.638X − 10.986).
DISCUSSION
The BIS monitoring algorithm was developed to combine the following four key EEG features that characterize the full spectrum of the anesthetic-induced changes: degree of high-frequency (14 to 30 Hz) activation, amount of low-frequency synchronization, presence of nearly suppressed periods within the EEG, and presence of fully suppressed (i.e., isoelectric, “flatline”) periods within the EEG. The algorithm enables the optimum combination of these EEG features to provide a reliable processed EEG parameter of the effects of the anesthetic and sedative [12]. However, if the changes in EEG induced by a specific drug are different from those of other sedatives or anesthetics, the reliability and cut-off BIS values should be re-evaluated. Dexmedetomidine, which is widely used in recent years, is a highly selective α2-adrenergic receptor agonist that acts on the locus coeruleus of the brain stem and exerts a sedative effect [13–15]. A study published in 2018 demonstrated that dexmedetomidine and propofol had different effects on the EEG, wherein both dexmedetomidine and propofol induced increased spindle power during moderate sedation. However, dexmedetomidine increased the theta power and decreased the alpha/beta/gamma power across the whole cortex, whereas propofol decreased the alpha power in the occipital area and increased the global beta/gamma power. During deep sedation, dexmedetomidine was associated with increased global theta power and frontocentral spindle power and decreased alpha/beta/gamma power across the whole cortex, whereas propofol was associated with increased theta/alpha/spindle/beta power, which was maximized in the frontal area [10]. Therefore, the reliability of the BIS value during dexmedetomidine sedation and the application of a cut-off value similar to that applied for propofol are debatable. Several studies have evaluated the performance of BIS and its correlations with clinical sedation scales (Richmond agitation-sedation scale, Ramsay sedation scale, and OAA/S) under dexmedetomidine sedation and reported that the performance of the BIS was reliable during dexmedetomidine sedation. However, most of these studies were conducted in ICU patients who were on mechanical ventilation, and one study was conducted in patients undergoing spinal anesthesia with dexmedetomidine sedation using target-controlled infusion, a method not often used in clinical practice because it requires a special infusion pump [16–19]. In the current study, we targeted patients who were undergoing surgery under spinal anesthesia and were treated with dexmedetomidine, which was administered as described in the pharmacopeia (a popular method).
A significant correlation between the BIS value and MOAA/S score was observed, as reported in previous studies [16–21]. However, the average value of the BIS for specific sedation level showed difference. In one study, where a manual infusion of dexmedetomidine was used, the BIS values for moderate sedation (OAA/S score = 3) and deep sedation (OAA/S score = 1–2) were 69.3 and 62.6, respectively [21]. In another study, which used the TCI of dexmedetomidine, a BIS value of 66.12 was reported for moderate sedation (MOAA/S score = 3) [17]. In the current study, the BIS value for an MOAA/S score of 3 was 75.85, and the BIS values for MOAA/S scores of 1 and 0 were 68.3 and 63.6, respectively. In 2009, Kasuya et al. [20] reported lower BIS values with dexmedetomidine sedation than with propofol sedation among healthy volunteers. Additionally, the suggested cut-off values during deep sedation (OAA/S score, ≤ 2) for propofol and dexmedetomidine were 67 and 46, respectively. In the present study, the cut-off value during deep sedation (MOAA/S score, ≤1) for dexmedetomidine was 73. These discrepancies in the BIS mean value might be attributed to the age of the patients, method of drug administration, type of surgery (noise and atmosphere of the operating room), and type of sedation scale used.
This study has few limitations. Additional studies involving a larger sample size, a wider age group, and an analysis of the EEG can further provide more meaningful results. Furthermore, a control group comprising patients who undergo surgery in a quiet environment is required. The disadvantage of using the MOAA/S, OAA/S, and RSS methods is that the external stimuli can interfere with the sedation. According to a previous study, 78% of healthy volunteers sedated by dexmedetomidine were awakened by verbal or physical stimulation [22,23]. Therefore, when analyzing the paired BIS and MOAA/S data, the BIS values immediately before and after the MOAA/S measurements might be different. To reduce the bias that may be caused by this phenomenon, the BIS data were examined starting from a maximum of 2.5 min before examining the MOAA/S scale until after checking the scale. Nevertheless, the results of our study showed that the BIS values were relatively high at MOAA/S scores of 5, 3, and 1 when compared to those reported in previous studies [24,25]. This is because that the observational sedation scale, the MOAA/S scale is subjective and the score may vary depending on the examiner. Clinical scoring systems indicate the status of the patient at a single moment in time. Therefore, it is necessary to apply a continuous, objective, and reliable monitoring method, such as the BIS monitoring system, to maintain the appropriate hypnotic depth.
In conclusion, we confirmed that BIS, a monitoring device with an algorithm based on changes in the EEG according to the level of consciousness, along with the clinical signs can be used to assess the hypnotic depth of a patient under dexmedetomidine sedation. However, the BIS value was close to 70 in some patients who were maintained at a deep sedation level with dexmedetomidine, which indicates that patients need to be closely monitored using methods that are different from those used for general anesthesia with propofol.
Notes
FUNDING
This work was supported by 2019 Inje University Busan Paik Hospital research fund.
CONFLICTS OF INTEREST
No potential conflict of interest relevant to this article was reported.
DATA AVAILABILITY STATEMENT
The datasets generated during and/or analyzed during the current study are available from the corresponding author on reasonable request.