


INTRODUCTION
Aeration of the lungs must be monitored during general anesthesia. During mechanical ventilation, a variety of postoperative pulmonary complications can occur, including atelectasis, effusions, or pneumonia [1-3]. There are several methods to diagnose perioperative lung aeration [4,5]. Imaging studies, such as magnetic resonance imaging (MRI) and computed tomography (CT) constitute the current standard methods; however, in addition to their high costs and requirement for radiation exposure, these methods are not available in the operating room. The inert gas rebreathing method also can detect perioperative changes in lung aeration, but specific equipment is required [6,7].
Ultrasound is a noninvasive and portable diagnostic tool that can be used at bedside. There is increasing use of ultrasound in the anesthesia field, including transthoracic lung ultrasonography (TLU). Recently, a few studies have attempted to use TLU for the measurement of lung aeration, but no standard protocol has been developed [8-11]. Among the findings on TLU, B-line is the most distinguishing feature indicative of reduction in lung aeration, and can easily be assessed by clinicians with minimal experience in TLU [9,12]. Because atelectasis is common after mechanical ventilation during general anesthesia, we hypothesized that the number of regions with B-line would increase in the postsurgical period.
The aim of this study was to compare PaO2/FiO2 and the number of regions with B-line on TLU between the postinduction and postsurgical periods.
MATERIALS AND METHODS
This prospective, observational study was approved by the Institutional Review Board (approval no: 3-2015-0130) of Gangnam Severance Hospital, Seoul, Korea; it was registered at clinical trials.gov (NCT02499536). Patient identification information and data were encoded and scrambled in a restricted computer; written informed consent was obtained from all patients.
Adult patients (≥ 20 years of age) undergoing major abdominal surgery under general anesthesia were enrolled in this study. Exclusion criteria were history of pulmonary disease (e.g., asthma, chronic obstructive pulmonary disease, or restrictive pulmonary disease), any consolidation or pathologic lesion on chest X-ray imaging, pregnancy, cardiopulmonary disease (e.g., arrhythmia, heart failure, or myocardial infarction), and cardiothoracic surgery.
In the operating room, all patients were monitored with electrocardiography, pulse oximetry, and noninvasive blood pressure measurement. After premedication with intravenous glycopyrrolate 0.1 mg, patients were preoxygenated with 100% O2 mask for 5 min. Anesthesia was induced with propofol 1.5 mg/kg and remifentanil 0.5 µg/kg. Patients were manually ventilated with 1 to 1.5 minimum alveolar concentration of sevoflurane in 100% oxygen and remifentanil 0.1 µg/kg/min, after confirming suppression of the eyelash reflex. For neuromuscular blockade, rocuronium 0.8 mg/kg was administered intravenously. Neuromuscular blockade was confirmed by loss of train-of-four twitch (TOF) at 120 s after rocuronium administration. Tracheal intubation was performed with a conventional endotracheal tube. After confirmation of endotracheal tube position, mechanical ventilation was initiated with volume-controlled ventilation mode. Tidal volume was set to 8 ml/kg, based on ideal body weight without positive end expiratory pressure (PEEP), and the respiration rate was adjusted to maintain partial pressure of carbon dioxide concentration between 32 and 36 mmHg. The inspiration: expiration ratio was set as 1:2, FiO2 as 0.5, and time of inspiratory pause/time of inspiration (TIP/TI) as 0.1. For each patient, a radial artery was cannulated to enable continuous monitoring of arterial pressure and blood gas analysis. During anesthesia, rocuronium infusion was continued to maintain TOF count less than 1.
Arterial blood gas analysis for PaO2/FiO2 calculation and TLU was performed at 30 min after the induction of anesthesia (postinduction period) and after skin closure (postsurgical period) while patients were under mechanical ventilation. Other study variables, such as mean arterial pressure, pulse rate, peak airway pressure, and plateau airway pressure were also recorded in the postinduction and postsurgical periods. TLU was performed by a single investigator using a portable EDGE ultrasound system (SonoSite, USA) using a curvilinear probe of 2-5 MHz or linear probe of 6-13 MHz. The thorax was divided into 6 regions in each lung (Fig. 1): anterior and posterior axillary lines were used to divide anterior, lateral, posterior regions; a line crossing the nipple was used to divide upper and lower regions [11]. Ultrasound images of each region were stored for further analysis at the most appropriate time to determine the presence of B-line. When necessary, the patient’s arm was abducted during the ultrasound examination. On ultrasound images, A-line was defined as a repetitive, horizontal reverberation artifact generated by air within the lungs, separated by regular intervals. This repetitive artifact represents normal or excessive air contents in the alveolar spaces. Furthermore, B-line was defined as a vertical, laser-like line that erased normal A-lines (Fig. 2) [8,9]; this line represents a reduction in acoustic mismatch between lung and surrounding tissues due to reduction in alveolar air, which may be a result of possible lung exudate/transudate, collagen, blood, or other factors.
Fig. 1
The thorax was divided into 6 regions in each lung. Anterior and posterior axillary lines were used to divide anterior, lateral, and posterior regions; a line crossing the nipple was used to divide upper and lower regions.
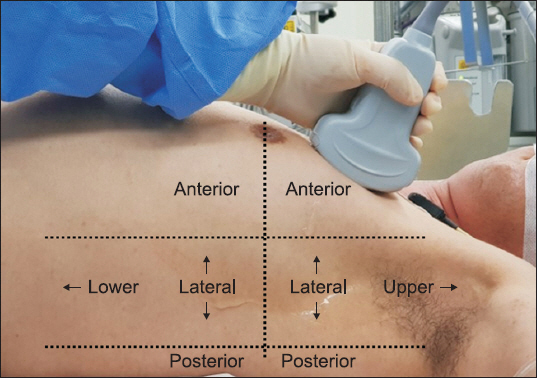
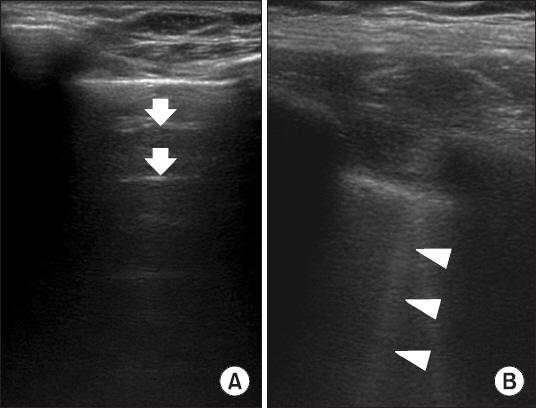
Fig. 2
A-line and B-line on transthoracic ultrasound. (A) Repetitive, horizontal reverberation artifacts generated by air within the lungs, separated by regular intervals (A-line, white arrow). (B) Vertical, laser-like lines that erase normal A-lines (B-line, white arrow heads).
Based on a study by Casati et al. [13], a sample size of 26 was required to detect mean (standard deviation, SD) difference in PaO2/FiO2 of 80 (137) mmHg at an α level of 0.05 and a power of 0.8, considering 10% dropout. Statistical analysis was performed using the SPSS version 20.0 (IBM, USA). Results were expressed as mean ± SD, median (interquartile range), or number of patients. The Kolmogorov-Smirnov test was used to assess the normality of continuous variable distributions. For comparison of parameters between postinduction and postsurgical periods, or between subgroups, a paired t-test or the Wilcoxon signed-rank test was used. To assess the association between the change in PaO2/FiO2 and number of regions with B-lines, Spearman correlation analysis was used.
RESULTS
Twenty-six patients were assessed for eligibility. No patient was excluded from the study. Patient characteristics are summarized in Table 1.
Table 1
Demographic Data
The number of regions with B-line was significantly higher in the postsurgical period than in the postinduction period (P < 0.001); however, no significant change in PaO2/FiO2 (P = 0.765) was observed. Although there was no significant difference in mean arterial pressure, both peak and plateau airway pressure increased in the postsurgical period (Table 2). Change in the number of regions with B-lines inversely correlated with change in PaO2/FiO2 (r = −0.575, P = 0.002).
Table 2
Postinduction-postsurgical PaO2/FiO2 and Number of B-lines on Transthoracic Ultrasonography (n = 26)
Values are presented as mean ± SD. PaO2/FiO2: partial pressure (mmHg) of arterial oxygen/fractional inspired oxygen ratio, B-line: number of regions in which B-lines were observed, SpO2: peripheral oxygen saturation, MBP: mean blood pressure, Peak: peak airway pressure, Plateau: plateau airway pressure.
Post hoc subgroup analysis was performed. Compared with postinduction values, 10 patients had the same or a lower number (Group A) and 16 patients had a higher number of regions with B-line (Group B). Demographic data of the subgroups are presented in Table 3. There were no differences in demographic data and PaO2/FiO2 between the 2 groups in both postinduction and postsurgical periods. However, the change in PaO2/FiO2 (postinduction-postsurgical period) was significantly higher in Group B than in Group A (P = 0.028) (Table 4).
Table 3
Comparison of Demographic Data between the Groups
Table 4
Postinduction-Postsurgical Differences between the Groups
Values are presented as mean ± SD or median (1Q, 3Q). Group A: no additional regions with B-line after surgery, Group B: more than 1 additional region with B-line after surgery, PaO2/FiO2: partial pressure of arterial oxygen/fractional inspired oxygen ratio, VO2: difference between postinduction-postsurgical PaO2/FiO2, SpO2: peripheral oxygen saturation, Peak: peak airway pressure, Plateau: plateau airway pressure.
DISCUSSION
The main finding of this study was that, although the number of regions with B-line in TLU increased in the postsurgical period, there was no difference in lung oxygenation in adult patients undergoing general anesthesia. However, change in the number of regions with B-lines inversely correlated with change in PaO2/FiO2.
A previous study regarding the efficacy of TLU for diagnosis of atelectasis reported 88% sensitivity, 89% specificity, and 88% accuracy, using MRI as reference [8]. When CT was used as reference, 87.7% sensitivity, 92.1% specificity, and 90.8% accuracy were reported [14]. B-lines on TLU can be observed in the lung when air withdrawal is caused by atelectasis. However, water, blood, connective tissue, and cell content can also generate B-lines [12,15]. Many different signs of atelectasis on TLU (e.g., consolation, air bronchogram, loss of lung sliding, and pulse sign) have been discussed for diagnosis of atelectasis; however, other pathologic conditions of the lung can also cause these signs to occur on TLU [8]. Development of grading systems has been attempted by combining these signs, but there is no standardized method to diagnose atelectasis with TLU [11,14]. Notably, TLU appears suitable for the detection of reduced aeration, rather than atelectasis. Recently, a pilot study reported that TLU may be a feasible tool to track perioperative atelectasis [11]. In that study, change in lung ultrasound score correlated with change in PaO2/FiO2. However, the use of multiple signs on TLU may increase inter-observer variability, and the use of a complicated grading system is not practical in a busy operating room setting. In contrast, assessment of the numbers of regions with or without B-line on TLU can easily be performed by clinicians who have minimal experience in TLU.
Because atelectasis is common after mechanical ventilation during general anesthesia, we hypothesized that the number of regions with B-line would increase in the postsurgical period [1,16]. However, although the number of regions with B-line was increased, PaO2/FiO2 did not decrease in the postsurgical period. This is likely because, in some patients, the number of regions with B-line decreased, while PaO2/FiO2 increased in the postsurgical period. This may be partly a result of patient characteristics. In this study, only healthy adult patients with American Society of Anesthesiologists physical status I or II were included. Obesity was not an exclusion criterion, but the mean ± SD body mass index was 24.1 ± 2.7 kg/m2 [2]. In a previous study of young patients undergoing laparoscopic cholecystectomy using FiO2 0.4, gas exchange was improved in the postsurgical period [17]. Although FiO2 1.0 was used during mask ventilation in this study (this practice can generate atelectasis in a short period), FiO2 was maintained at 0.5 during surgery [18]. In this study, 6 patients with an increased number of regions with B-line also showed increased PaO2/FiO2. In these patients, preoperative aeration loss other than ultrasonography-visible intrapulmonary changes seemed to be related to these changes. Reduction in intra-pulmonary shunt, change in pulmonary blood distribution, or change in compliance of thoracic cavity may constitute possible explanations [17,19,20]. However exact mechanisms remain unclear and further investigations are necessary.
Increased airway pressure was traditionally thought to be associated with reduction in aeration of the lungs. In the present study, both peak and plateau pressure were increased in the postsurgical period. Inflammatory or chemical stress from mechanical ventilation, pulmonary edema, or surgery-related lung injury may have influenced these increases in airway pressure [21,22]. Zero PEEP in the present study may also have influenced airway pressure because the use of PEEP may prevent atelectasis that occurs as a result of repeated airway closure associated with reduced end expiratory lung volume [16,23]. However, PaO2/FiO2, an indicator reflecting the aeration of the lungs, did not decrease in the postsurgical period. Based on the results of the present study, increased airway pressure cannot be considered a reliable factor to indicate aeration of the lungs. In contrast, PaO2/FiO2 appeared to decrease in associated with an increased number of regions with B-line in lung ultrasound. Although further research seems necessary, the results of the present study suggest that pulmonary ultrasound can be used in case of restrictions regarding arterial blood gas analysis during surgery, or for evaluating altered lung aeration.
There were several limitations in this study. First, atelectasis was not confirmed with a standard diagnostic method, such as CT or MRI. Thus, we could not evaluate the sensitivity or specificity of TLU. Second, because post hoc subgroup analysis was performed, the statistical significance of the change in PaO2/FiO2 is underpowered. Aside from these limitations, this is the first trial to evaluate the clinical significance of the number of regions with B-line on TLU, which can easily be performed by clinicians with minimal experience in TLU. Therefore, we hope to present the potential for this easy and novel perioperative oxygenation assessment tool to be used during surgery, thus encouraging further studies.
In conclusion, although the number of regions with B-line on TLU was increased in the postsurgical period, there was no difference in lung oxygenation based on the main result of this study. In contrast, patients with an increased number of regions with B-line tended to show a reduction in PaO2/FiO2 during the postsurgical period. However, further study seems necessary to establish the number of regions with B-line on TLU as a tool for the evaluation of perioperative oxygenation.
ORCID
Jae Chul Koh: https://orcid.org/0000-0002-1625-8650
Jung Hwa Hong: https://orcid.org/0000-0003-0321-0751
Tae Dong Kweon: https://orcid.org/0000-0002-5451-1856
Ju Yeon Park: https://orcid.org/0000-0002-4642-3717
Eunji Ko: https://orcid.org/0000-0003-0565-6802


